Immigrants from Central America vs Creek Bachelor's Degree
COMPARE
Immigrants from Central America
Creek
Bachelor's Degree
Bachelor's Degree Comparison
Immigrants from Central America
Creek
27.5%
BACHELOR'S DEGREE
0.0/ 100
METRIC RATING
329th/ 347
METRIC RANK
28.9%
BACHELOR'S DEGREE
0.0/ 100
METRIC RATING
319th/ 347
METRIC RANK
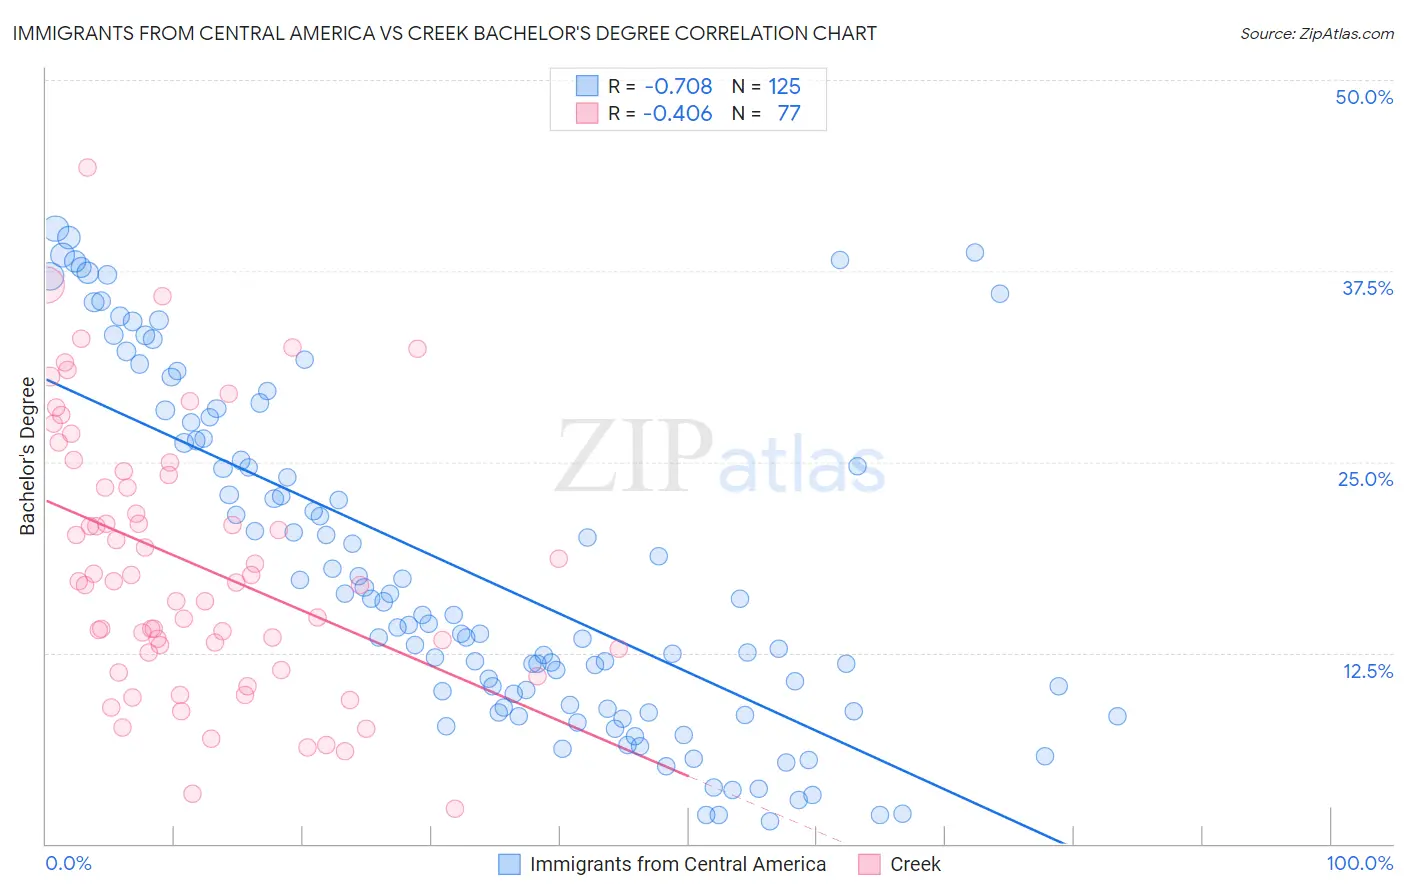
Immigrants from Central America vs Creek Bachelor's Degree Correlation Chart
The statistical analysis conducted on geographies consisting of 536,401,370 people shows a strong negative correlation between the proportion of Immigrants from Central America and percentage of population with at least bachelor's degree education in the United States with a correlation coefficient (R) of -0.708 and weighted average of 27.5%. Similarly, the statistical analysis conducted on geographies consisting of 178,478,956 people shows a moderate negative correlation between the proportion of Creek and percentage of population with at least bachelor's degree education in the United States with a correlation coefficient (R) of -0.406 and weighted average of 28.9%, a difference of 5.1%.
Bachelor's Degree Correlation Summary
| Measurement | Immigrants from Central America | Creek |
| Minimum | 1.4% | 2.3% |
| Maximum | 40.3% | 44.3% |
| Range | 38.8% | 42.0% |
| Mean | 17.9% | 18.4% |
| Median | 14.9% | 17.1% |
| Interquartile 25% (IQ1) | 8.9% | 12.7% |
| Interquartile 75% (IQ3) | 26.5% | 24.3% |
| Interquartile Range (IQR) | 17.6% | 11.6% |
| Standard Deviation (Sample) | 10.9% | 8.6% |
| Standard Deviation (Population) | 10.9% | 8.6% |
Demographics Similar to Immigrants from Central America and Creek by Bachelor's Degree
In terms of bachelor's degree, the demographic groups most similar to Immigrants from Central America are Spanish American Indian (27.5%, a difference of 0.060%), Immigrants from the Azores (27.3%, a difference of 0.54%), Menominee (27.3%, a difference of 0.64%), Crow (27.7%, a difference of 1.0%), and Mexican (27.1%, a difference of 1.5%). Similarly, the demographic groups most similar to Creek are Kiowa (28.8%, a difference of 0.040%), Alaskan Athabascan (28.8%, a difference of 0.13%), Tsimshian (28.8%, a difference of 0.35%), Yaqui (29.0%, a difference of 0.45%), and Fijian (28.7%, a difference of 0.48%).
| Demographics | Rating | Rank | Bachelor's Degree |
| Shoshone | 0.0 /100 | #314 | Tragic 29.3% |
| Immigrants | Cabo Verde | 0.0 /100 | #315 | Tragic 29.2% |
| Sioux | 0.0 /100 | #316 | Tragic 29.1% |
| Colville | 0.0 /100 | #317 | Tragic 29.0% |
| Yaqui | 0.0 /100 | #318 | Tragic 29.0% |
| Creek | 0.0 /100 | #319 | Tragic 28.9% |
| Kiowa | 0.0 /100 | #320 | Tragic 28.8% |
| Alaskan Athabascans | 0.0 /100 | #321 | Tragic 28.8% |
| Tsimshian | 0.0 /100 | #322 | Tragic 28.8% |
| Fijians | 0.0 /100 | #323 | Tragic 28.7% |
| Dutch West Indians | 0.0 /100 | #324 | Tragic 28.5% |
| Pennsylvania Germans | 0.0 /100 | #325 | Tragic 28.4% |
| Apache | 0.0 /100 | #326 | Tragic 28.3% |
| Paiute | 0.0 /100 | #327 | Tragic 28.1% |
| Crow | 0.0 /100 | #328 | Tragic 27.7% |
| Immigrants | Central America | 0.0 /100 | #329 | Tragic 27.5% |
| Spanish American Indians | 0.0 /100 | #330 | Tragic 27.5% |
| Immigrants | Azores | 0.0 /100 | #331 | Tragic 27.3% |
| Menominee | 0.0 /100 | #332 | Tragic 27.3% |
| Mexicans | 0.0 /100 | #333 | Tragic 27.1% |
| Arapaho | 0.0 /100 | #334 | Tragic 26.6% |