Immigrants from West Indies vs Immigrants from Kenya College, 1 year or more
COMPARE
Immigrants from West Indies
Immigrants from Kenya
College, 1 year or more
College, 1 year or more Comparison
Immigrants from West Indies
Immigrants from Kenya
55.2%
COLLEGE, 1 YEAR OR MORE
0.5/ 100
METRIC RATING
256th/ 347
METRIC RANK
60.5%
COLLEGE, 1 YEAR OR MORE
79.1/ 100
METRIC RATING
147th/ 347
METRIC RANK
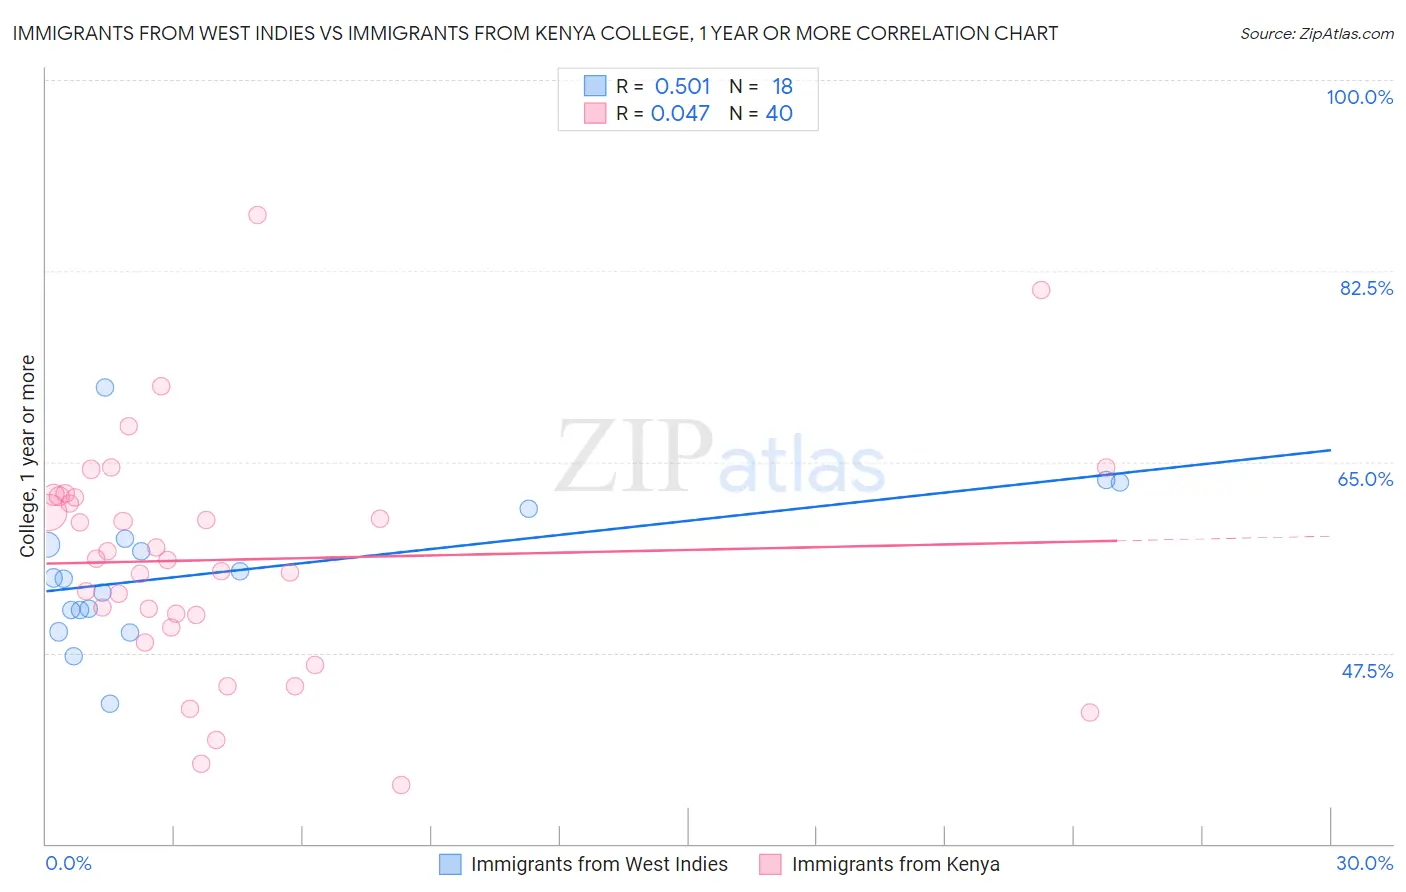
Immigrants from West Indies vs Immigrants from Kenya College, 1 year or more Correlation Chart
The statistical analysis conducted on geographies consisting of 72,420,477 people shows a substantial positive correlation between the proportion of Immigrants from West Indies and percentage of population with at least college, 1 year or more education in the United States with a correlation coefficient (R) of 0.501 and weighted average of 55.2%. Similarly, the statistical analysis conducted on geographies consisting of 218,085,582 people shows no correlation between the proportion of Immigrants from Kenya and percentage of population with at least college, 1 year or more education in the United States with a correlation coefficient (R) of 0.047 and weighted average of 60.5%, a difference of 9.6%.
College, 1 year or more Correlation Summary
| Measurement | Immigrants from West Indies | Immigrants from Kenya |
| Minimum | 42.9% | 35.4% |
| Maximum | 71.8% | 87.6% |
| Range | 28.9% | 52.2% |
| Mean | 55.1% | 56.0% |
| Median | 54.3% | 56.0% |
| Interquartile 25% (IQ1) | 51.4% | 50.4% |
| Interquartile 75% (IQ3) | 58.0% | 61.8% |
| Interquartile Range (IQR) | 6.6% | 11.4% |
| Standard Deviation (Sample) | 6.8% | 10.7% |
| Standard Deviation (Population) | 6.6% | 10.6% |
Similar Demographics by College, 1 year or more
Demographics Similar to Immigrants from West Indies by College, 1 year or more
In terms of college, 1 year or more, the demographic groups most similar to Immigrants from West Indies are Immigrants from Bahamas (55.2%, a difference of 0.080%), Indonesian (55.1%, a difference of 0.10%), Japanese (55.2%, a difference of 0.12%), Immigrants from Barbados (55.4%, a difference of 0.38%), and African (55.0%, a difference of 0.38%).
| Demographics | Rating | Rank | College, 1 year or more |
| Immigrants | Trinidad and Tobago | 0.7 /100 | #249 | Tragic 55.5% |
| Delaware | 0.7 /100 | #250 | Tragic 55.5% |
| Immigrants | Cambodia | 0.6 /100 | #251 | Tragic 55.4% |
| Aleuts | 0.6 /100 | #252 | Tragic 55.4% |
| Immigrants | Barbados | 0.6 /100 | #253 | Tragic 55.4% |
| Japanese | 0.5 /100 | #254 | Tragic 55.2% |
| Immigrants | Bahamas | 0.5 /100 | #255 | Tragic 55.2% |
| Immigrants | West Indies | 0.5 /100 | #256 | Tragic 55.2% |
| Indonesians | 0.4 /100 | #257 | Tragic 55.1% |
| Africans | 0.4 /100 | #258 | Tragic 55.0% |
| Nepalese | 0.3 /100 | #259 | Tragic 54.9% |
| Jamaicans | 0.3 /100 | #260 | Tragic 54.9% |
| Ottawa | 0.3 /100 | #261 | Tragic 54.9% |
| Immigrants | St. Vincent and the Grenadines | 0.3 /100 | #262 | Tragic 54.8% |
| U.S. Virgin Islanders | 0.3 /100 | #263 | Tragic 54.8% |
Demographics Similar to Immigrants from Kenya by College, 1 year or more
In terms of college, 1 year or more, the demographic groups most similar to Immigrants from Kenya are Kenyan (60.5%, a difference of 0.010%), Brazilian (60.5%, a difference of 0.010%), Scottish (60.5%, a difference of 0.090%), Immigrants from Sudan (60.4%, a difference of 0.10%), and Albanian (60.4%, a difference of 0.10%).
| Demographics | Rating | Rank | College, 1 year or more |
| Iraqis | 83.3 /100 | #140 | Excellent 60.7% |
| Immigrants | Afghanistan | 83.1 /100 | #141 | Excellent 60.7% |
| Poles | 82.8 /100 | #142 | Excellent 60.7% |
| Canadians | 82.7 /100 | #143 | Excellent 60.6% |
| Czechs | 81.9 /100 | #144 | Excellent 60.6% |
| Slavs | 81.1 /100 | #145 | Excellent 60.6% |
| Scottish | 80.2 /100 | #146 | Excellent 60.5% |
| Immigrants | Kenya | 79.1 /100 | #147 | Good 60.5% |
| Kenyans | 79.0 /100 | #148 | Good 60.5% |
| Brazilians | 79.0 /100 | #149 | Good 60.5% |
| Immigrants | Sudan | 77.8 /100 | #150 | Good 60.4% |
| Albanians | 77.8 /100 | #151 | Good 60.4% |
| Immigrants | Germany | 76.1 /100 | #152 | Good 60.3% |
| Sierra Leoneans | 74.1 /100 | #153 | Good 60.2% |
| Sudanese | 73.0 /100 | #154 | Good 60.2% |