African vs Cambodian College, 1 year or more
COMPARE
African
Cambodian
College, 1 year or more
College, 1 year or more Comparison
Africans
Cambodians
55.0%
COLLEGE, 1 YEAR OR MORE
0.4/ 100
METRIC RATING
258th/ 347
METRIC RANK
66.7%
COLLEGE, 1 YEAR OR MORE
100.0/ 100
METRIC RATING
15th/ 347
METRIC RANK
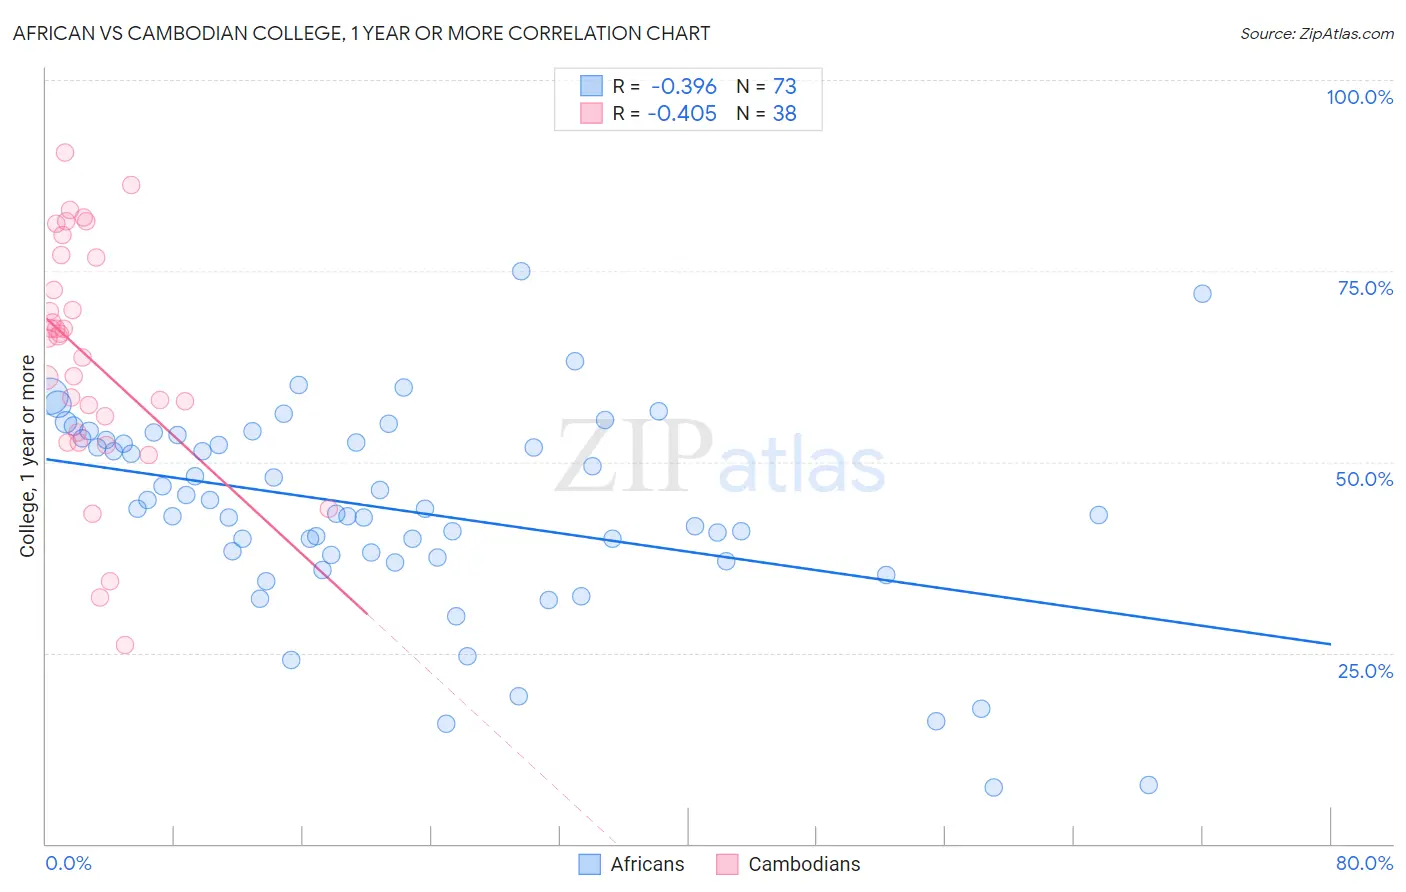
African vs Cambodian College, 1 year or more Correlation Chart
The statistical analysis conducted on geographies consisting of 470,090,594 people shows a mild negative correlation between the proportion of Africans and percentage of population with at least college, 1 year or more education in the United States with a correlation coefficient (R) of -0.396 and weighted average of 55.0%. Similarly, the statistical analysis conducted on geographies consisting of 102,514,976 people shows a moderate negative correlation between the proportion of Cambodians and percentage of population with at least college, 1 year or more education in the United States with a correlation coefficient (R) of -0.405 and weighted average of 66.7%, a difference of 21.4%.
College, 1 year or more Correlation Summary
| Measurement | African | Cambodian |
| Minimum | 7.4% | 26.0% |
| Maximum | 75.0% | 90.6% |
| Range | 67.6% | 64.6% |
| Mean | 43.7% | 63.6% |
| Median | 43.8% | 66.3% |
| Interquartile 25% (IQ1) | 37.7% | 53.8% |
| Interquartile 75% (IQ3) | 53.0% | 76.8% |
| Interquartile Range (IQR) | 15.3% | 23.0% |
| Standard Deviation (Sample) | 13.2% | 15.3% |
| Standard Deviation (Population) | 13.1% | 15.1% |
Similar Demographics by College, 1 year or more
Demographics Similar to Africans by College, 1 year or more
In terms of college, 1 year or more, the demographic groups most similar to Africans are Nepalese (54.9%, a difference of 0.060%), Jamaican (54.9%, a difference of 0.16%), Ottawa (54.9%, a difference of 0.19%), Immigrants from St. Vincent and the Grenadines (54.8%, a difference of 0.27%), and Indonesian (55.1%, a difference of 0.28%).
| Demographics | Rating | Rank | College, 1 year or more |
| Immigrants | Cambodia | 0.6 /100 | #251 | Tragic 55.4% |
| Aleuts | 0.6 /100 | #252 | Tragic 55.4% |
| Immigrants | Barbados | 0.6 /100 | #253 | Tragic 55.4% |
| Japanese | 0.5 /100 | #254 | Tragic 55.2% |
| Immigrants | Bahamas | 0.5 /100 | #255 | Tragic 55.2% |
| Immigrants | West Indies | 0.5 /100 | #256 | Tragic 55.2% |
| Indonesians | 0.4 /100 | #257 | Tragic 55.1% |
| Africans | 0.4 /100 | #258 | Tragic 55.0% |
| Nepalese | 0.3 /100 | #259 | Tragic 54.9% |
| Jamaicans | 0.3 /100 | #260 | Tragic 54.9% |
| Ottawa | 0.3 /100 | #261 | Tragic 54.9% |
| Immigrants | St. Vincent and the Grenadines | 0.3 /100 | #262 | Tragic 54.8% |
| U.S. Virgin Islanders | 0.3 /100 | #263 | Tragic 54.8% |
| Immigrants | Micronesia | 0.3 /100 | #264 | Tragic 54.8% |
| Immigrants | Laos | 0.2 /100 | #265 | Tragic 54.7% |
Demographics Similar to Cambodians by College, 1 year or more
In terms of college, 1 year or more, the demographic groups most similar to Cambodians are Burmese (66.7%, a difference of 0.0%), Immigrants from Japan (66.7%, a difference of 0.030%), Immigrants from Eastern Asia (66.6%, a difference of 0.15%), Immigrants from Sweden (66.8%, a difference of 0.19%), and Eastern European (66.6%, a difference of 0.22%).
| Demographics | Rating | Rank | College, 1 year or more |
| Thais | 100.0 /100 | #8 | Exceptional 68.6% |
| Immigrants | Israel | 100.0 /100 | #9 | Exceptional 67.8% |
| Immigrants | Australia | 100.0 /100 | #10 | Exceptional 67.7% |
| Immigrants | South Central Asia | 100.0 /100 | #11 | Exceptional 67.1% |
| Cypriots | 100.0 /100 | #12 | Exceptional 67.0% |
| Immigrants | Sweden | 100.0 /100 | #13 | Exceptional 66.8% |
| Burmese | 100.0 /100 | #14 | Exceptional 66.7% |
| Cambodians | 100.0 /100 | #15 | Exceptional 66.7% |
| Immigrants | Japan | 100.0 /100 | #16 | Exceptional 66.7% |
| Immigrants | Eastern Asia | 100.0 /100 | #17 | Exceptional 66.6% |
| Eastern Europeans | 100.0 /100 | #18 | Exceptional 66.6% |
| Immigrants | Switzerland | 100.0 /100 | #19 | Exceptional 66.5% |
| Immigrants | Korea | 100.0 /100 | #20 | Exceptional 66.5% |
| Immigrants | Hong Kong | 100.0 /100 | #21 | Exceptional 66.4% |
| Soviet Union | 100.0 /100 | #22 | Exceptional 66.4% |