Hawaiian vs Immigrants from Dominica Master's Degree
COMPARE
Hawaiian
Immigrants from Dominica
Master's Degree
Master's Degree Comparison
Hawaiians
Immigrants from Dominica
11.6%
MASTER'S DEGREE
0.1/ 100
METRIC RATING
294th/ 347
METRIC RANK
12.6%
MASTER'S DEGREE
0.8/ 100
METRIC RATING
253rd/ 347
METRIC RANK
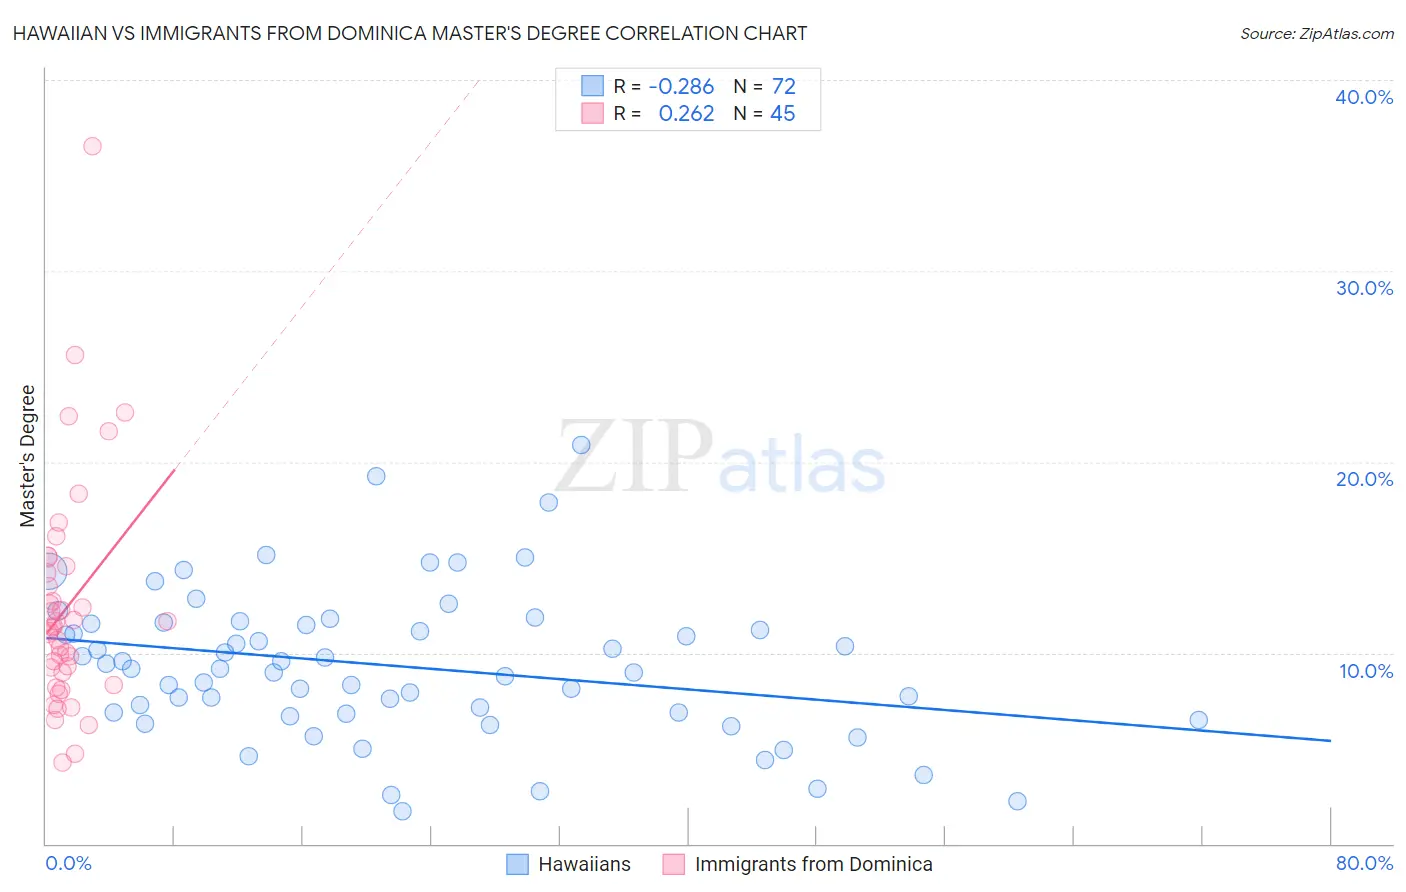
Hawaiian vs Immigrants from Dominica Master's Degree Correlation Chart
The statistical analysis conducted on geographies consisting of 327,485,009 people shows a weak negative correlation between the proportion of Hawaiians and percentage of population with at least master's degree education in the United States with a correlation coefficient (R) of -0.286 and weighted average of 11.6%. Similarly, the statistical analysis conducted on geographies consisting of 83,792,666 people shows a weak positive correlation between the proportion of Immigrants from Dominica and percentage of population with at least master's degree education in the United States with a correlation coefficient (R) of 0.262 and weighted average of 12.6%, a difference of 9.1%.
Master's Degree Correlation Summary
| Measurement | Hawaiian | Immigrants from Dominica |
| Minimum | 1.7% | 4.3% |
| Maximum | 20.9% | 36.5% |
| Range | 19.2% | 32.3% |
| Mean | 9.3% | 12.4% |
| Median | 9.2% | 11.3% |
| Interquartile 25% (IQ1) | 6.8% | 8.6% |
| Interquartile 75% (IQ3) | 11.5% | 14.4% |
| Interquartile Range (IQR) | 4.7% | 5.7% |
| Standard Deviation (Sample) | 3.9% | 6.0% |
| Standard Deviation (Population) | 3.8% | 5.9% |
Similar Demographics by Master's Degree
Demographics Similar to Hawaiians by Master's Degree
In terms of master's degree, the demographic groups most similar to Hawaiians are Alaska Native (11.6%, a difference of 0.10%), Marshallese (11.6%, a difference of 0.15%), Alaskan Athabascan (11.6%, a difference of 0.16%), Immigrants from Yemen (11.6%, a difference of 0.28%), and Immigrants from Guatemala (11.6%, a difference of 0.32%).
| Demographics | Rating | Rank | Master's Degree |
| Immigrants | Haiti | 0.1 /100 | #287 | Tragic 11.8% |
| Immigrants | Honduras | 0.1 /100 | #288 | Tragic 11.8% |
| Guatemalans | 0.1 /100 | #289 | Tragic 11.7% |
| Ute | 0.1 /100 | #290 | Tragic 11.7% |
| Colville | 0.1 /100 | #291 | Tragic 11.6% |
| Immigrants | Guatemala | 0.1 /100 | #292 | Tragic 11.6% |
| Alaska Natives | 0.1 /100 | #293 | Tragic 11.6% |
| Hawaiians | 0.1 /100 | #294 | Tragic 11.6% |
| Marshallese | 0.1 /100 | #295 | Tragic 11.6% |
| Alaskan Athabascans | 0.1 /100 | #296 | Tragic 11.6% |
| Immigrants | Yemen | 0.1 /100 | #297 | Tragic 11.6% |
| Samoans | 0.1 /100 | #298 | Tragic 11.5% |
| Chickasaw | 0.1 /100 | #299 | Tragic 11.4% |
| Chippewa | 0.1 /100 | #300 | Tragic 11.4% |
| Tsimshian | 0.1 /100 | #301 | Tragic 11.4% |
Demographics Similar to Immigrants from Dominica by Master's Degree
In terms of master's degree, the demographic groups most similar to Immigrants from Dominica are Indonesian (12.6%, a difference of 0.040%), Immigrants from Congo (12.6%, a difference of 0.070%), Immigrants from Portugal (12.6%, a difference of 0.14%), French American Indian (12.7%, a difference of 0.54%), and Osage (12.6%, a difference of 0.62%).
| Demographics | Rating | Rank | Master's Degree |
| Immigrants | Cambodia | 1.4 /100 | #246 | Tragic 12.9% |
| Iroquois | 1.4 /100 | #247 | Tragic 12.9% |
| Africans | 1.4 /100 | #248 | Tragic 12.9% |
| Cree | 1.3 /100 | #249 | Tragic 12.8% |
| Liberians | 1.3 /100 | #250 | Tragic 12.8% |
| Tlingit-Haida | 1.3 /100 | #251 | Tragic 12.8% |
| French American Indians | 1.0 /100 | #252 | Tragic 12.7% |
| Immigrants | Dominica | 0.8 /100 | #253 | Tragic 12.6% |
| Indonesians | 0.8 /100 | #254 | Tragic 12.6% |
| Immigrants | Congo | 0.8 /100 | #255 | Tragic 12.6% |
| Immigrants | Portugal | 0.8 /100 | #256 | Tragic 12.6% |
| Osage | 0.7 /100 | #257 | Tragic 12.6% |
| Immigrants | Liberia | 0.6 /100 | #258 | Tragic 12.5% |
| Japanese | 0.6 /100 | #259 | Tragic 12.5% |
| Dominicans | 0.6 /100 | #260 | Tragic 12.5% |