Immigrants from Ecuador vs Immigrants from Dominica 9th Grade
COMPARE
Immigrants from Ecuador
Immigrants from Dominica
9th Grade
9th Grade Comparison
Immigrants from Ecuador
Immigrants from Dominica
91.8%
9TH GRADE
0.0/ 100
METRIC RATING
321st/ 347
METRIC RANK
92.7%
9TH GRADE
0.0/ 100
METRIC RATING
302nd/ 347
METRIC RANK
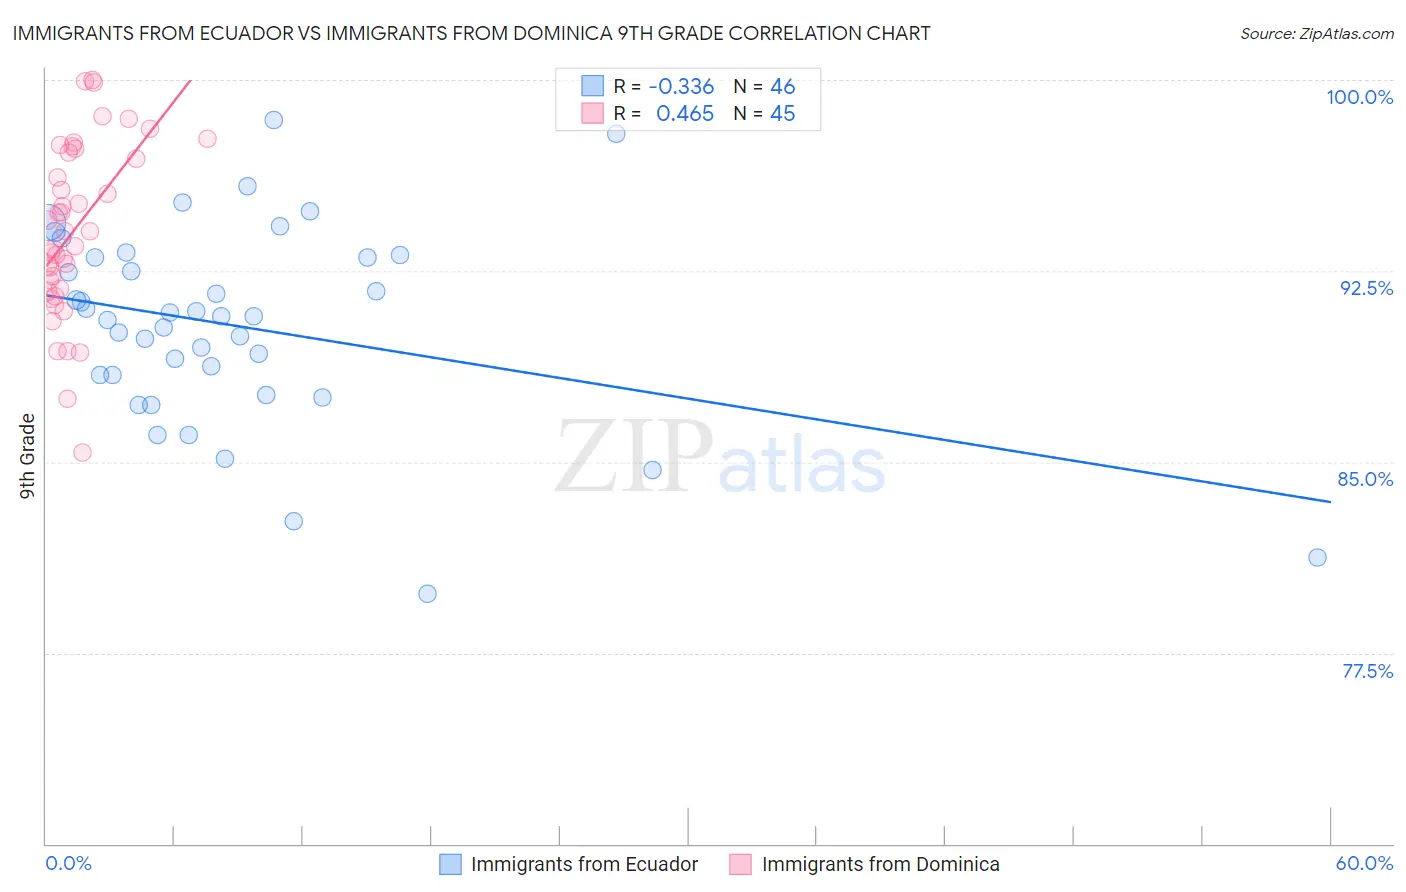
Immigrants from Ecuador vs Immigrants from Dominica 9th Grade Correlation Chart
The statistical analysis conducted on geographies consisting of 270,907,929 people shows a mild negative correlation between the proportion of Immigrants from Ecuador and percentage of population with at least 9th grade education in the United States with a correlation coefficient (R) of -0.336 and weighted average of 91.8%. Similarly, the statistical analysis conducted on geographies consisting of 83,794,115 people shows a moderate positive correlation between the proportion of Immigrants from Dominica and percentage of population with at least 9th grade education in the United States with a correlation coefficient (R) of 0.465 and weighted average of 92.7%, a difference of 0.90%.
9th Grade Correlation Summary
| Measurement | Immigrants from Ecuador | Immigrants from Dominica |
| Minimum | 79.8% | 85.4% |
| Maximum | 98.4% | 100.0% |
| Range | 18.6% | 14.6% |
| Mean | 90.3% | 94.1% |
| Median | 90.7% | 94.1% |
| Interquartile 25% (IQ1) | 88.4% | 91.7% |
| Interquartile 75% (IQ3) | 93.0% | 97.2% |
| Interquartile Range (IQR) | 4.6% | 5.5% |
| Standard Deviation (Sample) | 3.9% | 3.4% |
| Standard Deviation (Population) | 3.9% | 3.4% |
Demographics Similar to Immigrants from Ecuador and Immigrants from Dominica by 9th Grade
In terms of 9th grade, the demographic groups most similar to Immigrants from Ecuador are Nicaraguan (91.9%, a difference of 0.070%), Ecuadorian (91.9%, a difference of 0.11%), Nepalese (92.0%, a difference of 0.16%), Cape Verdean (92.2%, a difference of 0.38%), and Immigrants from Cuba (92.2%, a difference of 0.38%). Similarly, the demographic groups most similar to Immigrants from Dominica are Guyanese (92.7%, a difference of 0.020%), Tohono O'odham (92.6%, a difference of 0.040%), Japanese (92.6%, a difference of 0.060%), Immigrants from Vietnam (92.6%, a difference of 0.060%), and Immigrants from Haiti (92.7%, a difference of 0.080%).
| Demographics | Rating | Rank | 9th Grade |
| Immigrants | Haiti | 0.0 /100 | #301 | Tragic 92.7% |
| Immigrants | Dominica | 0.0 /100 | #302 | Tragic 92.7% |
| Guyanese | 0.0 /100 | #303 | Tragic 92.7% |
| Tohono O'odham | 0.0 /100 | #304 | Tragic 92.6% |
| Japanese | 0.0 /100 | #305 | Tragic 92.6% |
| Immigrants | Vietnam | 0.0 /100 | #306 | Tragic 92.6% |
| Immigrants | Immigrants | 0.0 /100 | #307 | Tragic 92.5% |
| Immigrants | Guyana | 0.0 /100 | #308 | Tragic 92.5% |
| Immigrants | Bangladesh | 0.0 /100 | #309 | Tragic 92.4% |
| Immigrants | Cambodia | 0.0 /100 | #310 | Tragic 92.4% |
| Immigrants | Fiji | 0.0 /100 | #311 | Tragic 92.3% |
| Houma | 0.0 /100 | #312 | Tragic 92.3% |
| Vietnamese | 0.0 /100 | #313 | Tragic 92.3% |
| Immigrants | Portugal | 0.0 /100 | #314 | Tragic 92.2% |
| Immigrants | Caribbean | 0.0 /100 | #315 | Tragic 92.2% |
| Cape Verdeans | 0.0 /100 | #316 | Tragic 92.2% |
| Immigrants | Cuba | 0.0 /100 | #317 | Tragic 92.2% |
| Nepalese | 0.0 /100 | #318 | Tragic 92.0% |
| Ecuadorians | 0.0 /100 | #319 | Tragic 91.9% |
| Nicaraguans | 0.0 /100 | #320 | Tragic 91.9% |
| Immigrants | Ecuador | 0.0 /100 | #321 | Tragic 91.8% |