Czechoslovakian vs Immigrants from Dominica 9th Grade
COMPARE
Czechoslovakian
Immigrants from Dominica
9th Grade
9th Grade Comparison
Czechoslovakians
Immigrants from Dominica
96.1%
9TH GRADE
99.9/ 100
METRIC RATING
41st/ 347
METRIC RANK
92.7%
9TH GRADE
0.0/ 100
METRIC RATING
302nd/ 347
METRIC RANK
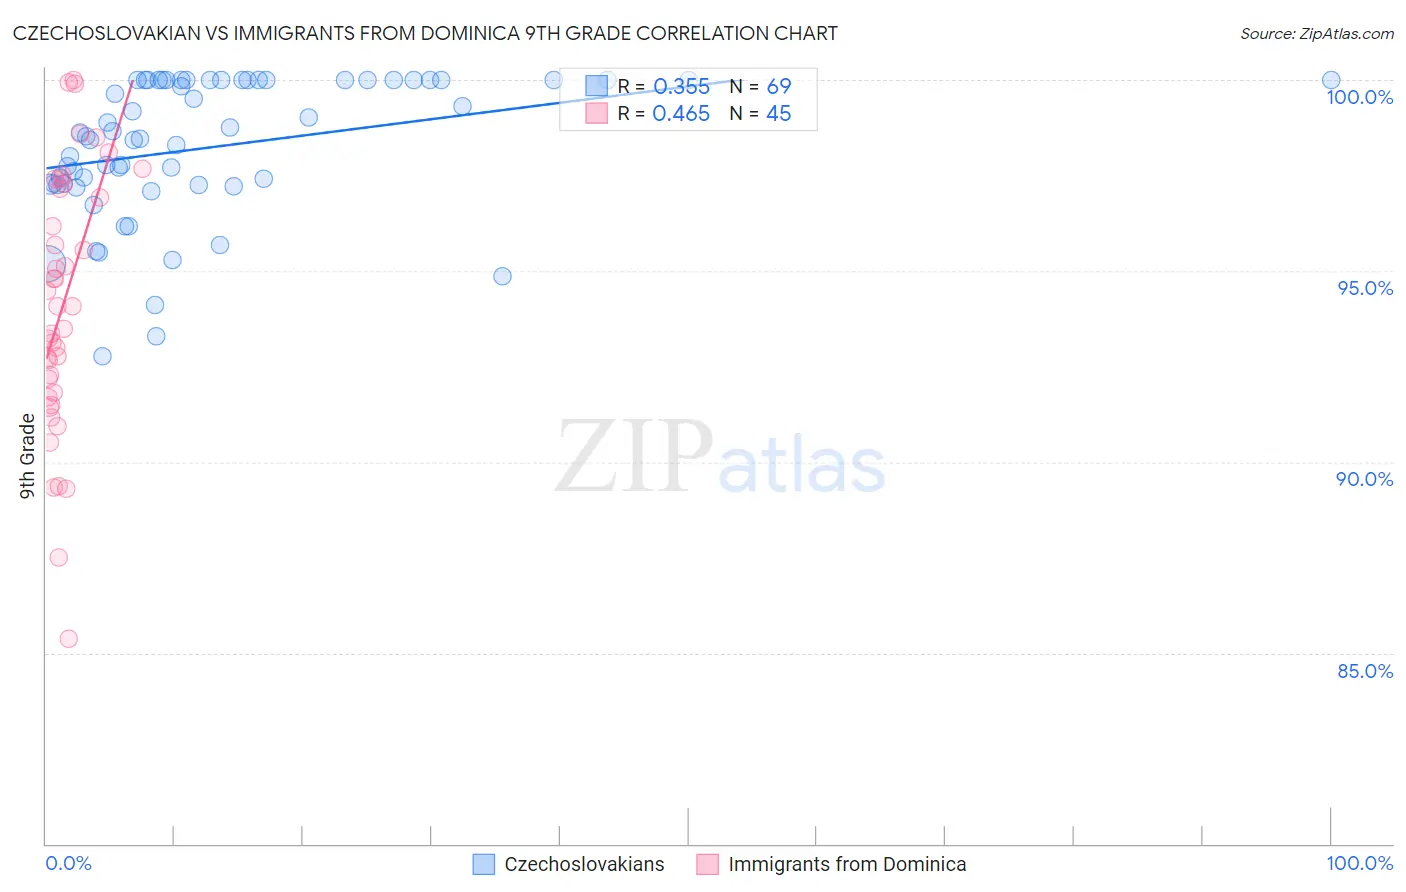
Czechoslovakian vs Immigrants from Dominica 9th Grade Correlation Chart
The statistical analysis conducted on geographies consisting of 368,668,876 people shows a mild positive correlation between the proportion of Czechoslovakians and percentage of population with at least 9th grade education in the United States with a correlation coefficient (R) of 0.355 and weighted average of 96.1%. Similarly, the statistical analysis conducted on geographies consisting of 83,794,115 people shows a moderate positive correlation between the proportion of Immigrants from Dominica and percentage of population with at least 9th grade education in the United States with a correlation coefficient (R) of 0.465 and weighted average of 92.7%, a difference of 3.7%.
9th Grade Correlation Summary
| Measurement | Czechoslovakian | Immigrants from Dominica |
| Minimum | 92.8% | 85.4% |
| Maximum | 100.0% | 100.0% |
| Range | 7.2% | 14.6% |
| Mean | 98.2% | 94.1% |
| Median | 98.5% | 94.1% |
| Interquartile 25% (IQ1) | 97.3% | 91.7% |
| Interquartile 75% (IQ3) | 100.0% | 97.2% |
| Interquartile Range (IQR) | 2.7% | 5.5% |
| Standard Deviation (Sample) | 1.8% | 3.4% |
| Standard Deviation (Population) | 1.8% | 3.4% |
Similar Demographics by 9th Grade
Demographics Similar to Czechoslovakians by 9th Grade
In terms of 9th grade, the demographic groups most similar to Czechoslovakians are Chippewa (96.1%, a difference of 0.0%), Slavic (96.1%, a difference of 0.010%), Iranian (96.1%, a difference of 0.010%), Ottawa (96.1%, a difference of 0.030%), and Alaska Native (96.1%, a difference of 0.030%).
| Demographics | Rating | Rank | 9th Grade |
| Hungarians | 100.0 /100 | #34 | Exceptional 96.2% |
| Bulgarians | 99.9 /100 | #35 | Exceptional 96.2% |
| Northern Europeans | 99.9 /100 | #36 | Exceptional 96.2% |
| Estonians | 99.9 /100 | #37 | Exceptional 96.1% |
| Immigrants | Scotland | 99.9 /100 | #38 | Exceptional 96.1% |
| Ottawa | 99.9 /100 | #39 | Exceptional 96.1% |
| Slavs | 99.9 /100 | #40 | Exceptional 96.1% |
| Czechoslovakians | 99.9 /100 | #41 | Exceptional 96.1% |
| Chippewa | 99.9 /100 | #42 | Exceptional 96.1% |
| Iranians | 99.9 /100 | #43 | Exceptional 96.1% |
| Alaska Natives | 99.9 /100 | #44 | Exceptional 96.1% |
| Crow | 99.9 /100 | #45 | Exceptional 96.1% |
| Immigrants | India | 99.9 /100 | #46 | Exceptional 96.1% |
| Russians | 99.9 /100 | #47 | Exceptional 96.0% |
| Australians | 99.9 /100 | #48 | Exceptional 96.0% |
Demographics Similar to Immigrants from Dominica by 9th Grade
In terms of 9th grade, the demographic groups most similar to Immigrants from Dominica are Guyanese (92.7%, a difference of 0.020%), Tohono O'odham (92.6%, a difference of 0.040%), Japanese (92.6%, a difference of 0.060%), Immigrants from Vietnam (92.6%, a difference of 0.060%), and Immigrants from Haiti (92.7%, a difference of 0.080%).
| Demographics | Rating | Rank | 9th Grade |
| Immigrants | Burma/Myanmar | 0.0 /100 | #295 | Tragic 93.1% |
| Indonesians | 0.0 /100 | #296 | Tragic 93.1% |
| Fijians | 0.0 /100 | #297 | Tragic 93.1% |
| Haitians | 0.0 /100 | #298 | Tragic 93.1% |
| Immigrants | Grenada | 0.0 /100 | #299 | Tragic 93.0% |
| Yaqui | 0.0 /100 | #300 | Tragic 92.9% |
| Immigrants | Haiti | 0.0 /100 | #301 | Tragic 92.7% |
| Immigrants | Dominica | 0.0 /100 | #302 | Tragic 92.7% |
| Guyanese | 0.0 /100 | #303 | Tragic 92.7% |
| Tohono O'odham | 0.0 /100 | #304 | Tragic 92.6% |
| Japanese | 0.0 /100 | #305 | Tragic 92.6% |
| Immigrants | Vietnam | 0.0 /100 | #306 | Tragic 92.6% |
| Immigrants | Immigrants | 0.0 /100 | #307 | Tragic 92.5% |
| Immigrants | Guyana | 0.0 /100 | #308 | Tragic 92.5% |
| Immigrants | Bangladesh | 0.0 /100 | #309 | Tragic 92.4% |