Immigrants from Ecuador vs Bhutanese 9th Grade
COMPARE
Immigrants from Ecuador
Bhutanese
9th Grade
9th Grade Comparison
Immigrants from Ecuador
Bhutanese
91.8%
9TH GRADE
0.0/ 100
METRIC RATING
321st/ 347
METRIC RANK
95.7%
9TH GRADE
99.3/ 100
METRIC RATING
80th/ 347
METRIC RANK
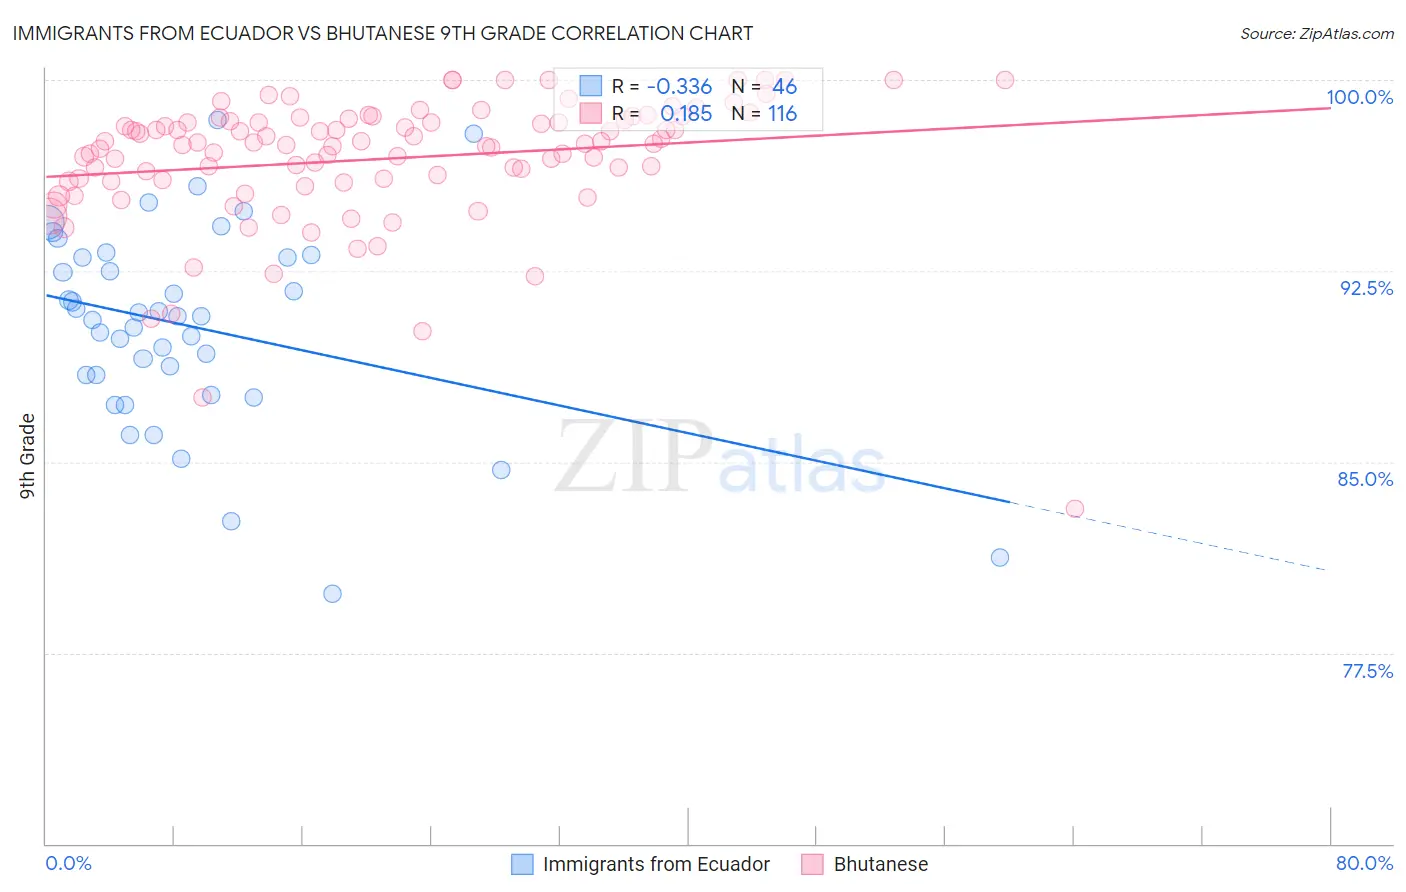
Immigrants from Ecuador vs Bhutanese 9th Grade Correlation Chart
The statistical analysis conducted on geographies consisting of 270,907,929 people shows a mild negative correlation between the proportion of Immigrants from Ecuador and percentage of population with at least 9th grade education in the United States with a correlation coefficient (R) of -0.336 and weighted average of 91.8%. Similarly, the statistical analysis conducted on geographies consisting of 455,591,134 people shows a poor positive correlation between the proportion of Bhutanese and percentage of population with at least 9th grade education in the United States with a correlation coefficient (R) of 0.185 and weighted average of 95.7%, a difference of 4.2%.
9th Grade Correlation Summary
| Measurement | Immigrants from Ecuador | Bhutanese |
| Minimum | 79.8% | 83.2% |
| Maximum | 98.4% | 100.0% |
| Range | 18.6% | 16.8% |
| Mean | 90.3% | 96.9% |
| Median | 90.7% | 97.5% |
| Interquartile 25% (IQ1) | 88.4% | 96.1% |
| Interquartile 75% (IQ3) | 93.0% | 98.4% |
| Interquartile Range (IQR) | 4.6% | 2.3% |
| Standard Deviation (Sample) | 3.9% | 2.6% |
| Standard Deviation (Population) | 3.9% | 2.6% |
Similar Demographics by 9th Grade
Demographics Similar to Immigrants from Ecuador by 9th Grade
In terms of 9th grade, the demographic groups most similar to Immigrants from Ecuador are Belizean (91.8%, a difference of 0.030%), Puerto Rican (91.8%, a difference of 0.030%), Nicaraguan (91.9%, a difference of 0.070%), Immigrants from Belize (91.8%, a difference of 0.090%), and Ecuadorian (91.9%, a difference of 0.11%).
| Demographics | Rating | Rank | 9th Grade |
| Immigrants | Portugal | 0.0 /100 | #314 | Tragic 92.2% |
| Immigrants | Caribbean | 0.0 /100 | #315 | Tragic 92.2% |
| Cape Verdeans | 0.0 /100 | #316 | Tragic 92.2% |
| Immigrants | Cuba | 0.0 /100 | #317 | Tragic 92.2% |
| Nepalese | 0.0 /100 | #318 | Tragic 92.0% |
| Ecuadorians | 0.0 /100 | #319 | Tragic 91.9% |
| Nicaraguans | 0.0 /100 | #320 | Tragic 91.9% |
| Immigrants | Ecuador | 0.0 /100 | #321 | Tragic 91.8% |
| Belizeans | 0.0 /100 | #322 | Tragic 91.8% |
| Puerto Ricans | 0.0 /100 | #323 | Tragic 91.8% |
| Immigrants | Belize | 0.0 /100 | #324 | Tragic 91.8% |
| Central American Indians | 0.0 /100 | #325 | Tragic 91.5% |
| Immigrants | Armenia | 0.0 /100 | #326 | Tragic 91.4% |
| Immigrants | Nicaragua | 0.0 /100 | #327 | Tragic 91.3% |
| Dominicans | 0.0 /100 | #328 | Tragic 91.1% |
Demographics Similar to Bhutanese by 9th Grade
In terms of 9th grade, the demographic groups most similar to Bhutanese are Arapaho (95.7%, a difference of 0.0%), Puget Sound Salish (95.7%, a difference of 0.0%), Romanian (95.7%, a difference of 0.020%), Swiss (95.7%, a difference of 0.020%), and Immigrants from Denmark (95.7%, a difference of 0.030%).
| Demographics | Rating | Rank | 9th Grade |
| Immigrants | Singapore | 99.5 /100 | #73 | Exceptional 95.8% |
| Thais | 99.5 /100 | #74 | Exceptional 95.8% |
| Inupiat | 99.5 /100 | #75 | Exceptional 95.8% |
| Immigrants | Sweden | 99.5 /100 | #76 | Exceptional 95.8% |
| Whites/Caucasians | 99.4 /100 | #77 | Exceptional 95.8% |
| Immigrants | South Africa | 99.4 /100 | #78 | Exceptional 95.8% |
| Romanians | 99.3 /100 | #79 | Exceptional 95.7% |
| Bhutanese | 99.3 /100 | #80 | Exceptional 95.7% |
| Arapaho | 99.3 /100 | #81 | Exceptional 95.7% |
| Puget Sound Salish | 99.2 /100 | #82 | Exceptional 95.7% |
| Swiss | 99.2 /100 | #83 | Exceptional 95.7% |
| Immigrants | Denmark | 99.1 /100 | #84 | Exceptional 95.7% |
| Icelanders | 99.1 /100 | #85 | Exceptional 95.7% |
| Immigrants | Western Europe | 99.1 /100 | #86 | Exceptional 95.7% |
| Okinawans | 99.0 /100 | #87 | Exceptional 95.7% |