Immigrants from Croatia vs Immigrants from Dominica 9th Grade
COMPARE
Immigrants from Croatia
Immigrants from Dominica
9th Grade
9th Grade Comparison
Immigrants from Croatia
Immigrants from Dominica
95.4%
9TH GRADE
96.2/ 100
METRIC RATING
112th/ 347
METRIC RANK
92.7%
9TH GRADE
0.0/ 100
METRIC RATING
302nd/ 347
METRIC RANK
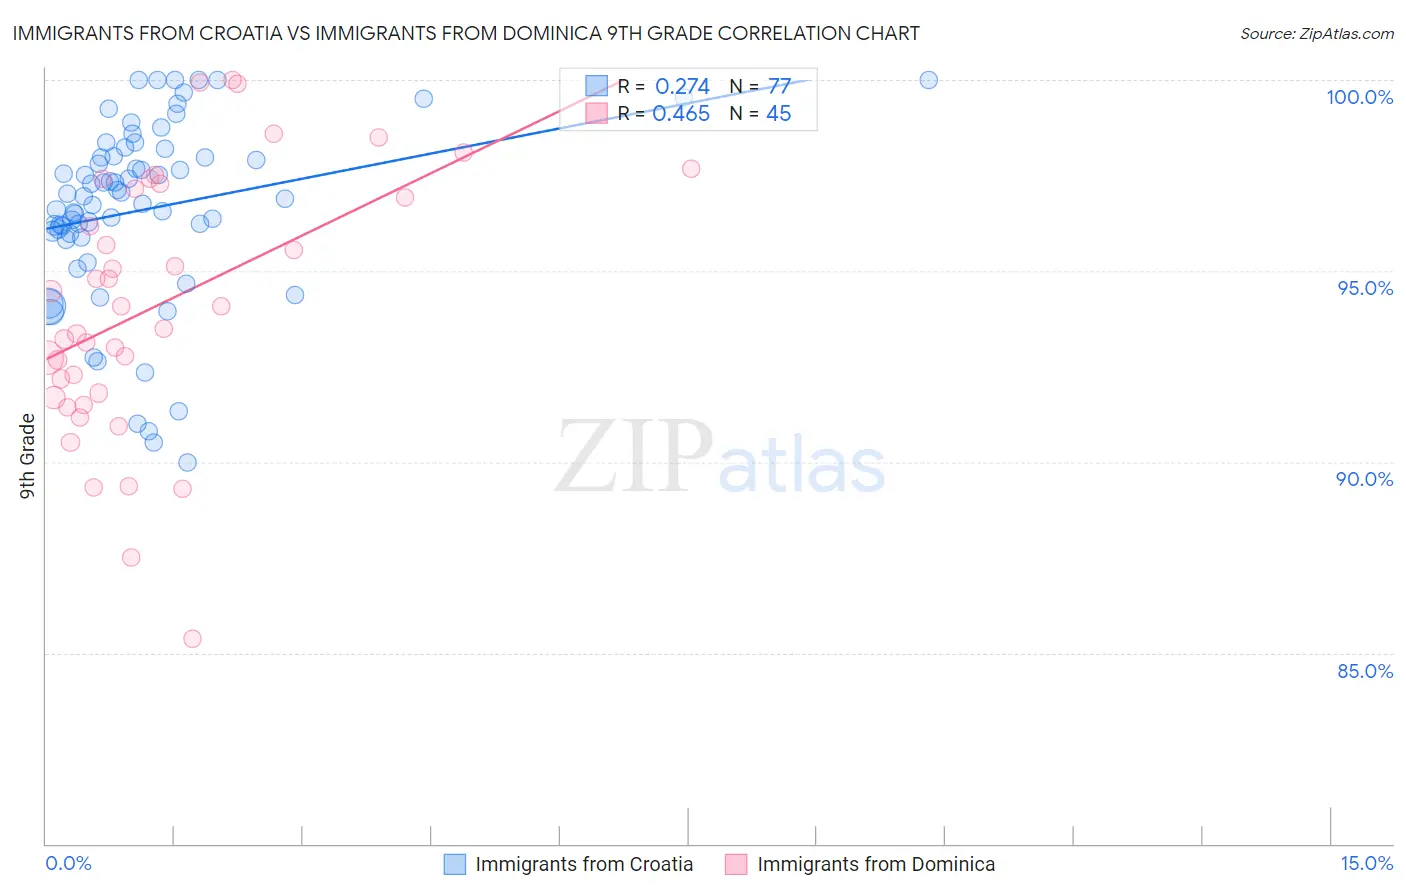
Immigrants from Croatia vs Immigrants from Dominica 9th Grade Correlation Chart
The statistical analysis conducted on geographies consisting of 132,548,291 people shows a weak positive correlation between the proportion of Immigrants from Croatia and percentage of population with at least 9th grade education in the United States with a correlation coefficient (R) of 0.274 and weighted average of 95.4%. Similarly, the statistical analysis conducted on geographies consisting of 83,794,115 people shows a moderate positive correlation between the proportion of Immigrants from Dominica and percentage of population with at least 9th grade education in the United States with a correlation coefficient (R) of 0.465 and weighted average of 92.7%, a difference of 3.0%.
9th Grade Correlation Summary
| Measurement | Immigrants from Croatia | Immigrants from Dominica |
| Minimum | 90.0% | 85.4% |
| Maximum | 100.0% | 100.0% |
| Range | 10.0% | 14.6% |
| Mean | 96.6% | 94.1% |
| Median | 97.0% | 94.1% |
| Interquartile 25% (IQ1) | 95.9% | 91.7% |
| Interquartile 75% (IQ3) | 98.1% | 97.2% |
| Interquartile Range (IQR) | 2.2% | 5.5% |
| Standard Deviation (Sample) | 2.4% | 3.4% |
| Standard Deviation (Population) | 2.4% | 3.4% |
Similar Demographics by 9th Grade
Demographics Similar to Immigrants from Croatia by 9th Grade
In terms of 9th grade, the demographic groups most similar to Immigrants from Croatia are Cherokee (95.4%, a difference of 0.0%), Iroquois (95.4%, a difference of 0.0%), German Russian (95.4%, a difference of 0.010%), Burmese (95.4%, a difference of 0.010%), and Immigrants from Europe (95.4%, a difference of 0.020%).
| Demographics | Rating | Rank | 9th Grade |
| Immigrants | France | 97.4 /100 | #105 | Exceptional 95.5% |
| Immigrants | Norway | 97.1 /100 | #106 | Exceptional 95.5% |
| Immigrants | Zimbabwe | 96.9 /100 | #107 | Exceptional 95.5% |
| Chickasaw | 96.8 /100 | #108 | Exceptional 95.5% |
| Osage | 96.8 /100 | #109 | Exceptional 95.5% |
| Immigrants | Bulgaria | 96.7 /100 | #110 | Exceptional 95.5% |
| Cherokee | 96.3 /100 | #111 | Exceptional 95.4% |
| Immigrants | Croatia | 96.2 /100 | #112 | Exceptional 95.4% |
| Iroquois | 96.2 /100 | #113 | Exceptional 95.4% |
| German Russians | 96.1 /100 | #114 | Exceptional 95.4% |
| Burmese | 96.0 /100 | #115 | Exceptional 95.4% |
| Immigrants | Europe | 95.7 /100 | #116 | Exceptional 95.4% |
| Immigrants | Romania | 95.6 /100 | #117 | Exceptional 95.4% |
| Immigrants | Turkey | 95.6 /100 | #118 | Exceptional 95.4% |
| Soviet Union | 95.6 /100 | #119 | Exceptional 95.4% |
Demographics Similar to Immigrants from Dominica by 9th Grade
In terms of 9th grade, the demographic groups most similar to Immigrants from Dominica are Guyanese (92.7%, a difference of 0.020%), Tohono O'odham (92.6%, a difference of 0.040%), Japanese (92.6%, a difference of 0.060%), Immigrants from Vietnam (92.6%, a difference of 0.060%), and Immigrants from Haiti (92.7%, a difference of 0.080%).
| Demographics | Rating | Rank | 9th Grade |
| Immigrants | Burma/Myanmar | 0.0 /100 | #295 | Tragic 93.1% |
| Indonesians | 0.0 /100 | #296 | Tragic 93.1% |
| Fijians | 0.0 /100 | #297 | Tragic 93.1% |
| Haitians | 0.0 /100 | #298 | Tragic 93.1% |
| Immigrants | Grenada | 0.0 /100 | #299 | Tragic 93.0% |
| Yaqui | 0.0 /100 | #300 | Tragic 92.9% |
| Immigrants | Haiti | 0.0 /100 | #301 | Tragic 92.7% |
| Immigrants | Dominica | 0.0 /100 | #302 | Tragic 92.7% |
| Guyanese | 0.0 /100 | #303 | Tragic 92.7% |
| Tohono O'odham | 0.0 /100 | #304 | Tragic 92.6% |
| Japanese | 0.0 /100 | #305 | Tragic 92.6% |
| Immigrants | Vietnam | 0.0 /100 | #306 | Tragic 92.6% |
| Immigrants | Immigrants | 0.0 /100 | #307 | Tragic 92.5% |
| Immigrants | Guyana | 0.0 /100 | #308 | Tragic 92.5% |
| Immigrants | Bangladesh | 0.0 /100 | #309 | Tragic 92.4% |