Basque vs Immigrants from Dominica 9th Grade
COMPARE
Basque
Immigrants from Dominica
9th Grade
9th Grade Comparison
Basques
Immigrants from Dominica
95.4%
9TH GRADE
94.1/ 100
METRIC RATING
129th/ 347
METRIC RANK
92.7%
9TH GRADE
0.0/ 100
METRIC RATING
302nd/ 347
METRIC RANK
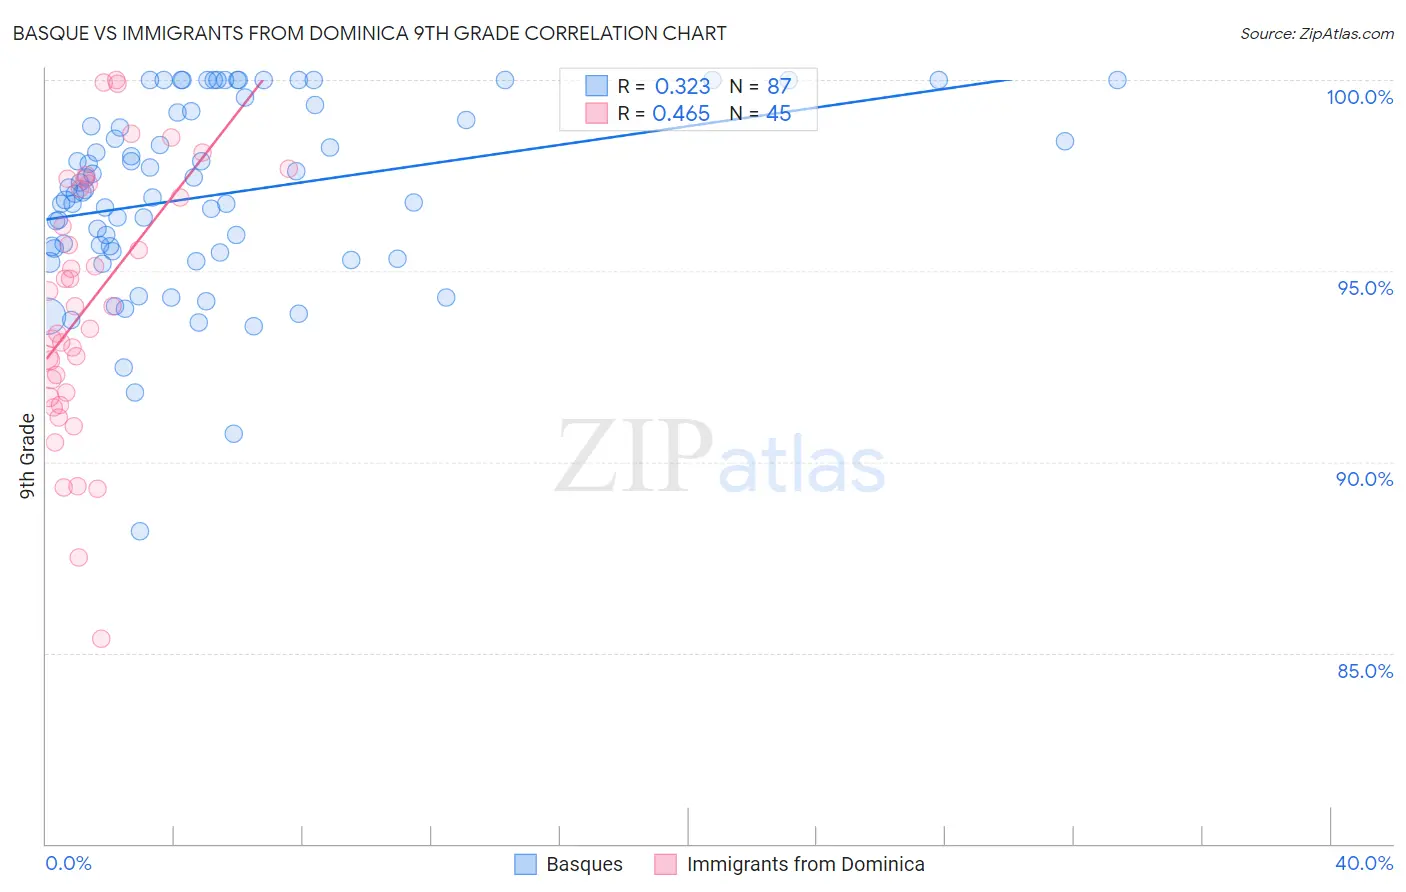
Basque vs Immigrants from Dominica 9th Grade Correlation Chart
The statistical analysis conducted on geographies consisting of 165,777,136 people shows a mild positive correlation between the proportion of Basques and percentage of population with at least 9th grade education in the United States with a correlation coefficient (R) of 0.323 and weighted average of 95.4%. Similarly, the statistical analysis conducted on geographies consisting of 83,794,115 people shows a moderate positive correlation between the proportion of Immigrants from Dominica and percentage of population with at least 9th grade education in the United States with a correlation coefficient (R) of 0.465 and weighted average of 92.7%, a difference of 2.9%.
9th Grade Correlation Summary
| Measurement | Basque | Immigrants from Dominica |
| Minimum | 88.2% | 85.4% |
| Maximum | 100.0% | 100.0% |
| Range | 11.8% | 14.6% |
| Mean | 97.0% | 94.1% |
| Median | 97.1% | 94.1% |
| Interquartile 25% (IQ1) | 95.5% | 91.7% |
| Interquartile 75% (IQ3) | 99.2% | 97.2% |
| Interquartile Range (IQR) | 3.6% | 5.5% |
| Standard Deviation (Sample) | 2.4% | 3.4% |
| Standard Deviation (Population) | 2.4% | 3.4% |
Similar Demographics by 9th Grade
Demographics Similar to Basques by 9th Grade
In terms of 9th grade, the demographic groups most similar to Basques are Immigrants from Hungary (95.4%, a difference of 0.0%), Immigrants from Serbia (95.4%, a difference of 0.010%), Palestinian (95.4%, a difference of 0.010%), Jordanian (95.3%, a difference of 0.020%), and Immigrants from South Central Asia (95.4%, a difference of 0.030%).
| Demographics | Rating | Rank | 9th Grade |
| Immigrants | Kuwait | 95.5 /100 | #122 | Exceptional 95.4% |
| Kiowa | 95.3 /100 | #123 | Exceptional 95.4% |
| Shoshone | 95.3 /100 | #124 | Exceptional 95.4% |
| Immigrants | South Central Asia | 95.1 /100 | #125 | Exceptional 95.4% |
| Immigrants | Serbia | 94.4 /100 | #126 | Exceptional 95.4% |
| Palestinians | 94.3 /100 | #127 | Exceptional 95.4% |
| Immigrants | Hungary | 94.2 /100 | #128 | Exceptional 95.4% |
| Basques | 94.1 /100 | #129 | Exceptional 95.4% |
| Jordanians | 93.5 /100 | #130 | Exceptional 95.3% |
| Immigrants | North Macedonia | 92.3 /100 | #131 | Exceptional 95.3% |
| Immigrants | Nonimmigrants | 92.0 /100 | #132 | Exceptional 95.3% |
| Israelis | 90.4 /100 | #133 | Exceptional 95.3% |
| Immigrants | Israel | 89.6 /100 | #134 | Excellent 95.3% |
| Immigrants | Belarus | 88.9 /100 | #135 | Excellent 95.2% |
| Immigrants | Iran | 88.3 /100 | #136 | Excellent 95.2% |
Demographics Similar to Immigrants from Dominica by 9th Grade
In terms of 9th grade, the demographic groups most similar to Immigrants from Dominica are Guyanese (92.7%, a difference of 0.020%), Tohono O'odham (92.6%, a difference of 0.040%), Japanese (92.6%, a difference of 0.060%), Immigrants from Vietnam (92.6%, a difference of 0.060%), and Immigrants from Haiti (92.7%, a difference of 0.080%).
| Demographics | Rating | Rank | 9th Grade |
| Immigrants | Burma/Myanmar | 0.0 /100 | #295 | Tragic 93.1% |
| Indonesians | 0.0 /100 | #296 | Tragic 93.1% |
| Fijians | 0.0 /100 | #297 | Tragic 93.1% |
| Haitians | 0.0 /100 | #298 | Tragic 93.1% |
| Immigrants | Grenada | 0.0 /100 | #299 | Tragic 93.0% |
| Yaqui | 0.0 /100 | #300 | Tragic 92.9% |
| Immigrants | Haiti | 0.0 /100 | #301 | Tragic 92.7% |
| Immigrants | Dominica | 0.0 /100 | #302 | Tragic 92.7% |
| Guyanese | 0.0 /100 | #303 | Tragic 92.7% |
| Tohono O'odham | 0.0 /100 | #304 | Tragic 92.6% |
| Japanese | 0.0 /100 | #305 | Tragic 92.6% |
| Immigrants | Vietnam | 0.0 /100 | #306 | Tragic 92.6% |
| Immigrants | Immigrants | 0.0 /100 | #307 | Tragic 92.5% |
| Immigrants | Guyana | 0.0 /100 | #308 | Tragic 92.5% |
| Immigrants | Bangladesh | 0.0 /100 | #309 | Tragic 92.4% |