Immigrants from Eastern Europe vs Immigrants from Sierra Leone College, Under 1 year
COMPARE
Immigrants from Eastern Europe
Immigrants from Sierra Leone
College, Under 1 year
College, Under 1 year Comparison
Immigrants from Eastern Europe
Immigrants from Sierra Leone
67.9%
COLLEGE, UNDER 1 YEAR
96.9/ 100
METRIC RATING
101st/ 347
METRIC RANK
65.1%
COLLEGE, UNDER 1 YEAR
39.7/ 100
METRIC RATING
186th/ 347
METRIC RANK
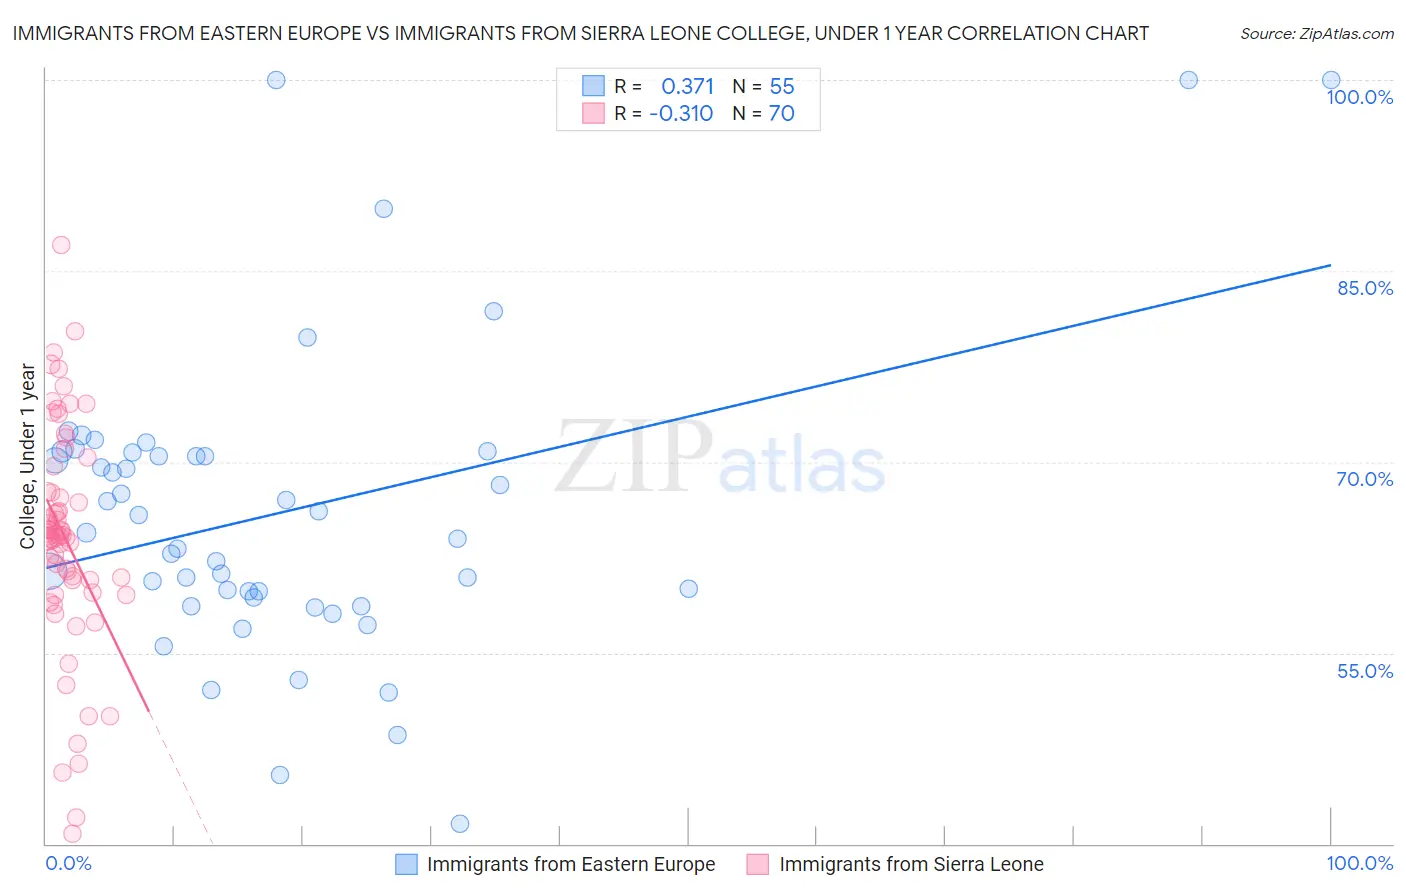
Immigrants from Eastern Europe vs Immigrants from Sierra Leone College, Under 1 year Correlation Chart
The statistical analysis conducted on geographies consisting of 475,875,489 people shows a mild positive correlation between the proportion of Immigrants from Eastern Europe and percentage of population with at least college, under 1 year education in the United States with a correlation coefficient (R) of 0.371 and weighted average of 67.9%. Similarly, the statistical analysis conducted on geographies consisting of 101,652,497 people shows a mild negative correlation between the proportion of Immigrants from Sierra Leone and percentage of population with at least college, under 1 year education in the United States with a correlation coefficient (R) of -0.310 and weighted average of 65.1%, a difference of 4.3%.
College, Under 1 year Correlation Summary
| Measurement | Immigrants from Eastern Europe | Immigrants from Sierra Leone |
| Minimum | 41.6% | 40.8% |
| Maximum | 100.0% | 87.0% |
| Range | 58.4% | 46.2% |
| Mean | 66.0% | 64.1% |
| Median | 64.5% | 64.2% |
| Interquartile 25% (IQ1) | 59.4% | 60.7% |
| Interquartile 75% (IQ3) | 70.7% | 67.7% |
| Interquartile Range (IQR) | 11.3% | 7.0% |
| Standard Deviation (Sample) | 11.8% | 8.8% |
| Standard Deviation (Population) | 11.7% | 8.7% |
Similar Demographics by College, Under 1 year
Demographics Similar to Immigrants from Eastern Europe by College, Under 1 year
In terms of college, under 1 year, the demographic groups most similar to Immigrants from Eastern Europe are Palestinian (67.9%, a difference of 0.0%), Carpatho Rusyn (67.9%, a difference of 0.010%), Immigrants from Argentina (67.9%, a difference of 0.050%), Immigrants from Bolivia (67.9%, a difference of 0.060%), and Paraguayan (67.9%, a difference of 0.080%).
| Demographics | Rating | Rank | College, Under 1 year |
| Armenians | 97.7 /100 | #94 | Exceptional 68.1% |
| Immigrants | Pakistan | 97.5 /100 | #95 | Exceptional 68.0% |
| Jordanians | 97.4 /100 | #96 | Exceptional 68.0% |
| Immigrants | Ethiopia | 97.3 /100 | #97 | Exceptional 68.0% |
| Paraguayans | 97.1 /100 | #98 | Exceptional 67.9% |
| Immigrants | Bolivia | 97.0 /100 | #99 | Exceptional 67.9% |
| Immigrants | Argentina | 97.0 /100 | #100 | Exceptional 67.9% |
| Immigrants | Eastern Europe | 96.9 /100 | #101 | Exceptional 67.9% |
| Palestinians | 96.9 /100 | #102 | Exceptional 67.9% |
| Carpatho Rusyns | 96.8 /100 | #103 | Exceptional 67.9% |
| Immigrants | Western Asia | 96.6 /100 | #104 | Exceptional 67.8% |
| Afghans | 96.6 /100 | #105 | Exceptional 67.8% |
| Immigrants | Croatia | 96.6 /100 | #106 | Exceptional 67.8% |
| Austrians | 96.4 /100 | #107 | Exceptional 67.8% |
| Immigrants | Egypt | 96.0 /100 | #108 | Exceptional 67.7% |
Demographics Similar to Immigrants from Sierra Leone by College, Under 1 year
In terms of college, under 1 year, the demographic groups most similar to Immigrants from Sierra Leone are Sri Lankan (65.2%, a difference of 0.090%), Bermudan (65.2%, a difference of 0.10%), Immigrants from Poland (65.2%, a difference of 0.13%), Immigrants from Africa (65.3%, a difference of 0.23%), and Spaniard (65.3%, a difference of 0.26%).
| Demographics | Rating | Rank | College, Under 1 year |
| Guamanians/Chamorros | 48.2 /100 | #179 | Average 65.4% |
| Dutch | 46.1 /100 | #180 | Average 65.3% |
| Spaniards | 45.5 /100 | #181 | Average 65.3% |
| Immigrants | Africa | 44.7 /100 | #182 | Average 65.3% |
| Immigrants | Poland | 42.6 /100 | #183 | Average 65.2% |
| Bermudans | 42.0 /100 | #184 | Average 65.2% |
| Sri Lankans | 41.7 /100 | #185 | Average 65.2% |
| Immigrants | Sierra Leone | 39.7 /100 | #186 | Fair 65.1% |
| Immigrants | Southern Europe | 34.3 /100 | #187 | Fair 64.9% |
| Immigrants | Albania | 32.0 /100 | #188 | Fair 64.9% |
| Spanish | 31.6 /100 | #189 | Fair 64.9% |
| Immigrants | Philippines | 30.1 /100 | #190 | Fair 64.8% |
| Immigrants | Armenia | 28.1 /100 | #191 | Fair 64.7% |
| Immigrants | Thailand | 27.0 /100 | #192 | Fair 64.7% |
| Slovaks | 26.7 /100 | #193 | Fair 64.7% |