Immigrants from Eastern Europe vs Immigrants from Nepal 4th Grade
COMPARE
Immigrants from Eastern Europe
Immigrants from Nepal
4th Grade
4th Grade Comparison
Immigrants from Eastern Europe
Immigrants from Nepal
97.6%
4TH GRADE
71.3/ 100
METRIC RATING
153rd/ 347
METRIC RANK
97.3%
4TH GRADE
7.7/ 100
METRIC RATING
214th/ 347
METRIC RANK
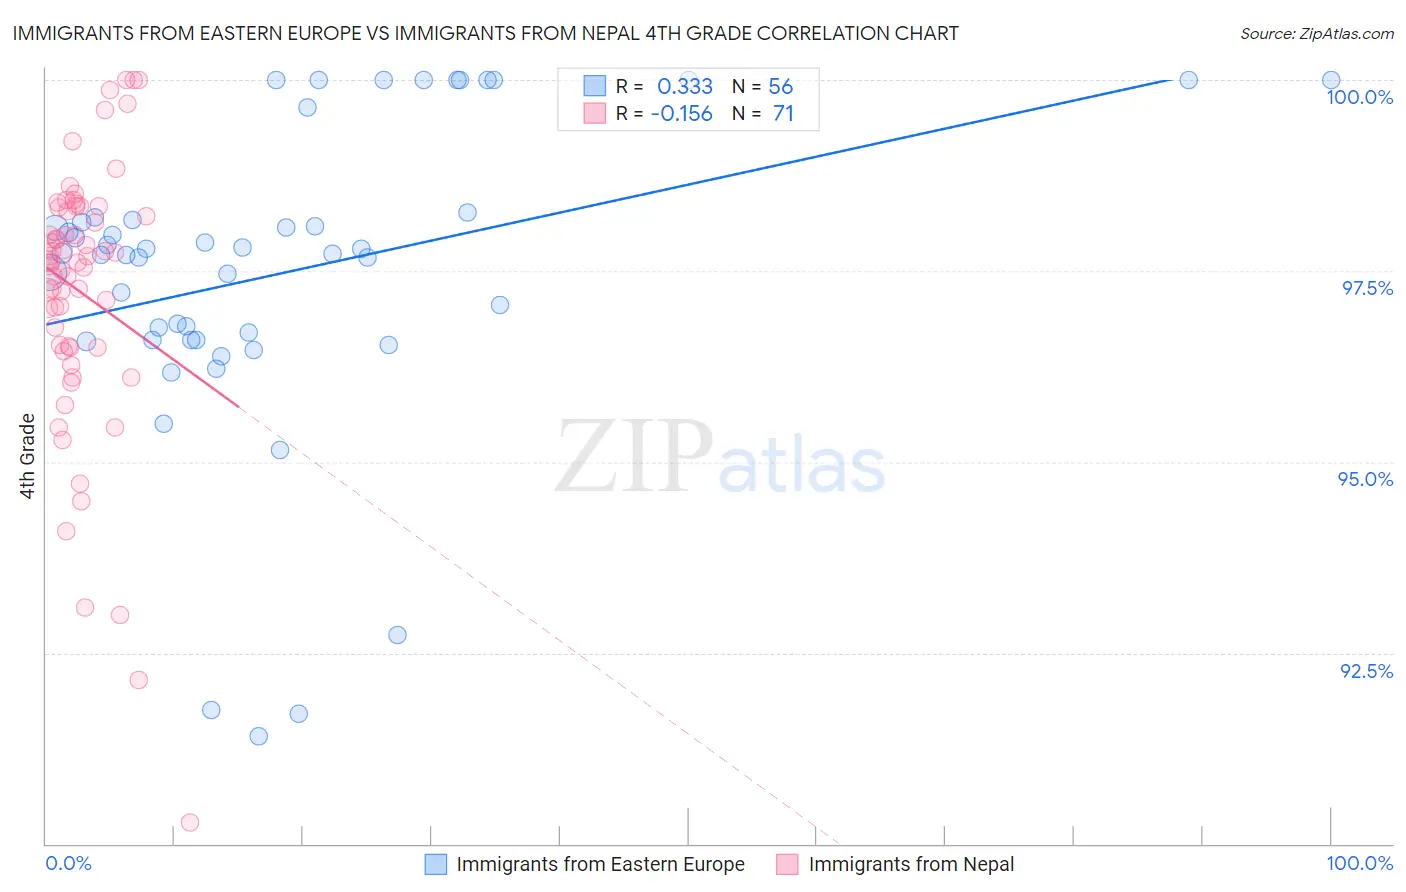
Immigrants from Eastern Europe vs Immigrants from Nepal 4th Grade Correlation Chart
The statistical analysis conducted on geographies consisting of 475,879,420 people shows a mild positive correlation between the proportion of Immigrants from Eastern Europe and percentage of population with at least 4th grade education in the United States with a correlation coefficient (R) of 0.333 and weighted average of 97.6%. Similarly, the statistical analysis conducted on geographies consisting of 186,739,570 people shows a poor negative correlation between the proportion of Immigrants from Nepal and percentage of population with at least 4th grade education in the United States with a correlation coefficient (R) of -0.156 and weighted average of 97.3%, a difference of 0.32%.
4th Grade Correlation Summary
| Measurement | Immigrants from Eastern Europe | Immigrants from Nepal |
| Minimum | 91.4% | 90.3% |
| Maximum | 100.0% | 100.0% |
| Range | 8.6% | 9.7% |
| Mean | 97.5% | 97.2% |
| Median | 97.7% | 97.6% |
| Interquartile 25% (IQ1) | 96.6% | 96.5% |
| Interquartile 75% (IQ3) | 98.2% | 98.3% |
| Interquartile Range (IQR) | 1.6% | 1.8% |
| Standard Deviation (Sample) | 2.0% | 1.8% |
| Standard Deviation (Population) | 2.0% | 1.8% |
Similar Demographics by 4th Grade
Demographics Similar to Immigrants from Eastern Europe by 4th Grade
In terms of 4th grade, the demographic groups most similar to Immigrants from Eastern Europe are Immigrants from South Central Asia (97.6%, a difference of 0.020%), Immigrants from Russia (97.6%, a difference of 0.020%), Albanian (97.6%, a difference of 0.020%), Immigrants from Jordan (97.6%, a difference of 0.020%), and Immigrants from Bosnia and Herzegovina (97.6%, a difference of 0.020%).
| Demographics | Rating | Rank | 4th Grade |
| Jordanians | 81.3 /100 | #146 | Excellent 97.7% |
| Ute | 80.6 /100 | #147 | Excellent 97.7% |
| Hopi | 80.6 /100 | #148 | Excellent 97.7% |
| Soviet Union | 77.8 /100 | #149 | Good 97.6% |
| Immigrants | Israel | 77.7 /100 | #150 | Good 97.6% |
| Alsatians | 77.2 /100 | #151 | Good 97.6% |
| Immigrants | South Central Asia | 76.2 /100 | #152 | Good 97.6% |
| Immigrants | Eastern Europe | 71.3 /100 | #153 | Good 97.6% |
| Immigrants | Russia | 67.0 /100 | #154 | Good 97.6% |
| Albanians | 67.0 /100 | #155 | Good 97.6% |
| Immigrants | Jordan | 66.9 /100 | #156 | Good 97.6% |
| Immigrants | Bosnia and Herzegovina | 66.0 /100 | #157 | Good 97.6% |
| French American Indians | 65.9 /100 | #158 | Good 97.6% |
| Immigrants | Italy | 63.7 /100 | #159 | Good 97.6% |
| Apache | 61.3 /100 | #160 | Good 97.6% |
Demographics Similar to Immigrants from Nepal by 4th Grade
In terms of 4th grade, the demographic groups most similar to Immigrants from Nepal are Tohono O'odham (97.3%, a difference of 0.010%), Costa Rican (97.3%, a difference of 0.010%), Immigrants from Morocco (97.3%, a difference of 0.010%), Samoan (97.3%, a difference of 0.010%), and Laotian (97.3%, a difference of 0.020%).
| Demographics | Rating | Rank | 4th Grade |
| Moroccans | 11.3 /100 | #207 | Poor 97.3% |
| Immigrants | Bahamas | 10.8 /100 | #208 | Poor 97.3% |
| Laotians | 9.3 /100 | #209 | Tragic 97.3% |
| Immigrants | Oceania | 9.1 /100 | #210 | Tragic 97.3% |
| Sudanese | 9.0 /100 | #211 | Tragic 97.3% |
| Tohono O'odham | 8.4 /100 | #212 | Tragic 97.3% |
| Costa Ricans | 8.3 /100 | #213 | Tragic 97.3% |
| Immigrants | Nepal | 7.7 /100 | #214 | Tragic 97.3% |
| Immigrants | Morocco | 7.1 /100 | #215 | Tragic 97.3% |
| Samoans | 6.8 /100 | #216 | Tragic 97.3% |
| Sierra Leoneans | 6.5 /100 | #217 | Tragic 97.3% |
| Iraqis | 6.3 /100 | #218 | Tragic 97.3% |
| Tongans | 5.8 /100 | #219 | Tragic 97.3% |
| South American Indians | 5.5 /100 | #220 | Tragic 97.3% |
| Immigrants | Panama | 5.4 /100 | #221 | Tragic 97.3% |