Black/African American vs Immigrants from Nepal 4th Grade
COMPARE
Black/African American
Immigrants from Nepal
4th Grade
4th Grade Comparison
Blacks/African Americans
Immigrants from Nepal
97.4%
4TH GRADE
31.1/ 100
METRIC RATING
190th/ 347
METRIC RANK
97.3%
4TH GRADE
7.7/ 100
METRIC RATING
214th/ 347
METRIC RANK
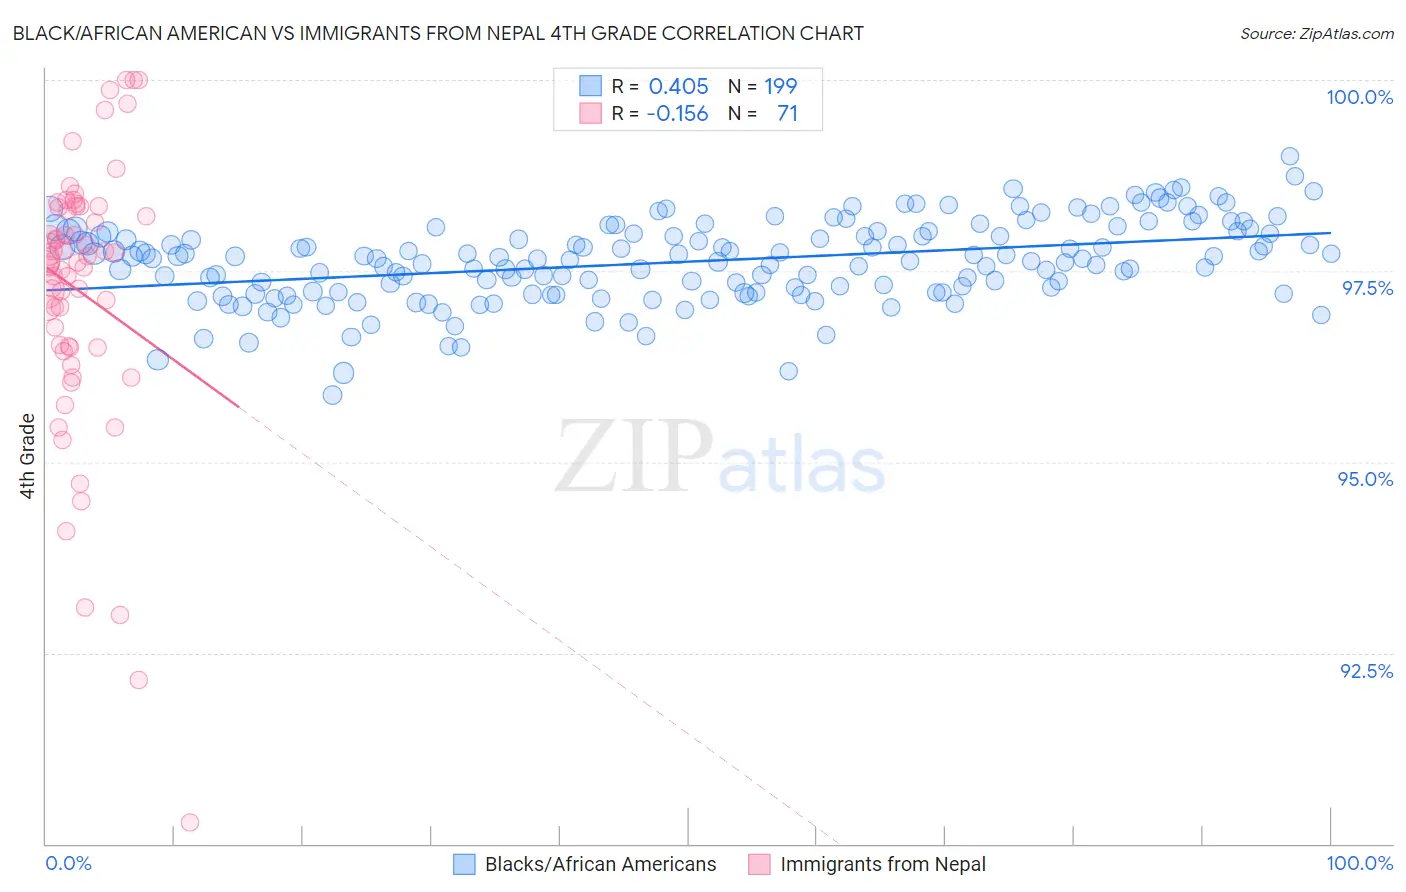
Black/African American vs Immigrants from Nepal 4th Grade Correlation Chart
The statistical analysis conducted on geographies consisting of 566,043,750 people shows a moderate positive correlation between the proportion of Blacks/African Americans and percentage of population with at least 4th grade education in the United States with a correlation coefficient (R) of 0.405 and weighted average of 97.4%. Similarly, the statistical analysis conducted on geographies consisting of 186,739,570 people shows a poor negative correlation between the proportion of Immigrants from Nepal and percentage of population with at least 4th grade education in the United States with a correlation coefficient (R) of -0.156 and weighted average of 97.3%, a difference of 0.16%.
4th Grade Correlation Summary
| Measurement | Black/African American | Immigrants from Nepal |
| Minimum | 95.9% | 90.3% |
| Maximum | 99.0% | 100.0% |
| Range | 3.1% | 9.7% |
| Mean | 97.6% | 97.2% |
| Median | 97.7% | 97.6% |
| Interquartile 25% (IQ1) | 97.2% | 96.5% |
| Interquartile 75% (IQ3) | 98.0% | 98.3% |
| Interquartile Range (IQR) | 0.79% | 1.8% |
| Standard Deviation (Sample) | 0.53% | 1.8% |
| Standard Deviation (Population) | 0.53% | 1.8% |
Similar Demographics by 4th Grade
Demographics Similar to Blacks/African Americans by 4th Grade
In terms of 4th grade, the demographic groups most similar to Blacks/African Americans are Panamanian (97.4%, a difference of 0.0%), Navajo (97.4%, a difference of 0.0%), Immigrants from Ukraine (97.4%, a difference of 0.0%), Immigrants from Egypt (97.4%, a difference of 0.0%), and Portuguese (97.4%, a difference of 0.010%).
| Demographics | Rating | Rank | 4th Grade |
| Argentineans | 39.0 /100 | #183 | Fair 97.5% |
| Pakistanis | 36.2 /100 | #184 | Fair 97.5% |
| Immigrants | Kenya | 35.8 /100 | #185 | Fair 97.5% |
| Dutch West Indians | 35.8 /100 | #186 | Fair 97.5% |
| Mongolians | 34.7 /100 | #187 | Fair 97.5% |
| Immigrants | Argentina | 34.6 /100 | #188 | Fair 97.5% |
| Panamanians | 31.9 /100 | #189 | Fair 97.4% |
| Blacks/African Americans | 31.1 /100 | #190 | Fair 97.4% |
| Navajo | 30.7 /100 | #191 | Fair 97.4% |
| Immigrants | Ukraine | 30.1 /100 | #192 | Fair 97.4% |
| Immigrants | Egypt | 30.1 /100 | #193 | Fair 97.4% |
| Portuguese | 29.2 /100 | #194 | Fair 97.4% |
| Paraguayans | 28.9 /100 | #195 | Fair 97.4% |
| Immigrants | Albania | 27.7 /100 | #196 | Fair 97.4% |
| Hawaiians | 25.6 /100 | #197 | Fair 97.4% |
Demographics Similar to Immigrants from Nepal by 4th Grade
In terms of 4th grade, the demographic groups most similar to Immigrants from Nepal are Tohono O'odham (97.3%, a difference of 0.010%), Costa Rican (97.3%, a difference of 0.010%), Immigrants from Morocco (97.3%, a difference of 0.010%), Samoan (97.3%, a difference of 0.010%), and Laotian (97.3%, a difference of 0.020%).
| Demographics | Rating | Rank | 4th Grade |
| Moroccans | 11.3 /100 | #207 | Poor 97.3% |
| Immigrants | Bahamas | 10.8 /100 | #208 | Poor 97.3% |
| Laotians | 9.3 /100 | #209 | Tragic 97.3% |
| Immigrants | Oceania | 9.1 /100 | #210 | Tragic 97.3% |
| Sudanese | 9.0 /100 | #211 | Tragic 97.3% |
| Tohono O'odham | 8.4 /100 | #212 | Tragic 97.3% |
| Costa Ricans | 8.3 /100 | #213 | Tragic 97.3% |
| Immigrants | Nepal | 7.7 /100 | #214 | Tragic 97.3% |
| Immigrants | Morocco | 7.1 /100 | #215 | Tragic 97.3% |
| Samoans | 6.8 /100 | #216 | Tragic 97.3% |
| Sierra Leoneans | 6.5 /100 | #217 | Tragic 97.3% |
| Iraqis | 6.3 /100 | #218 | Tragic 97.3% |
| Tongans | 5.8 /100 | #219 | Tragic 97.3% |
| South American Indians | 5.5 /100 | #220 | Tragic 97.3% |
| Immigrants | Panama | 5.4 /100 | #221 | Tragic 97.3% |