Immigrants from Eastern Europe vs Cambodian 4th Grade
COMPARE
Immigrants from Eastern Europe
Cambodian
4th Grade
4th Grade Comparison
Immigrants from Eastern Europe
Cambodians
97.6%
4TH GRADE
71.3/ 100
METRIC RATING
153rd/ 347
METRIC RANK
97.7%
4TH GRADE
87.8/ 100
METRIC RATING
135th/ 347
METRIC RANK
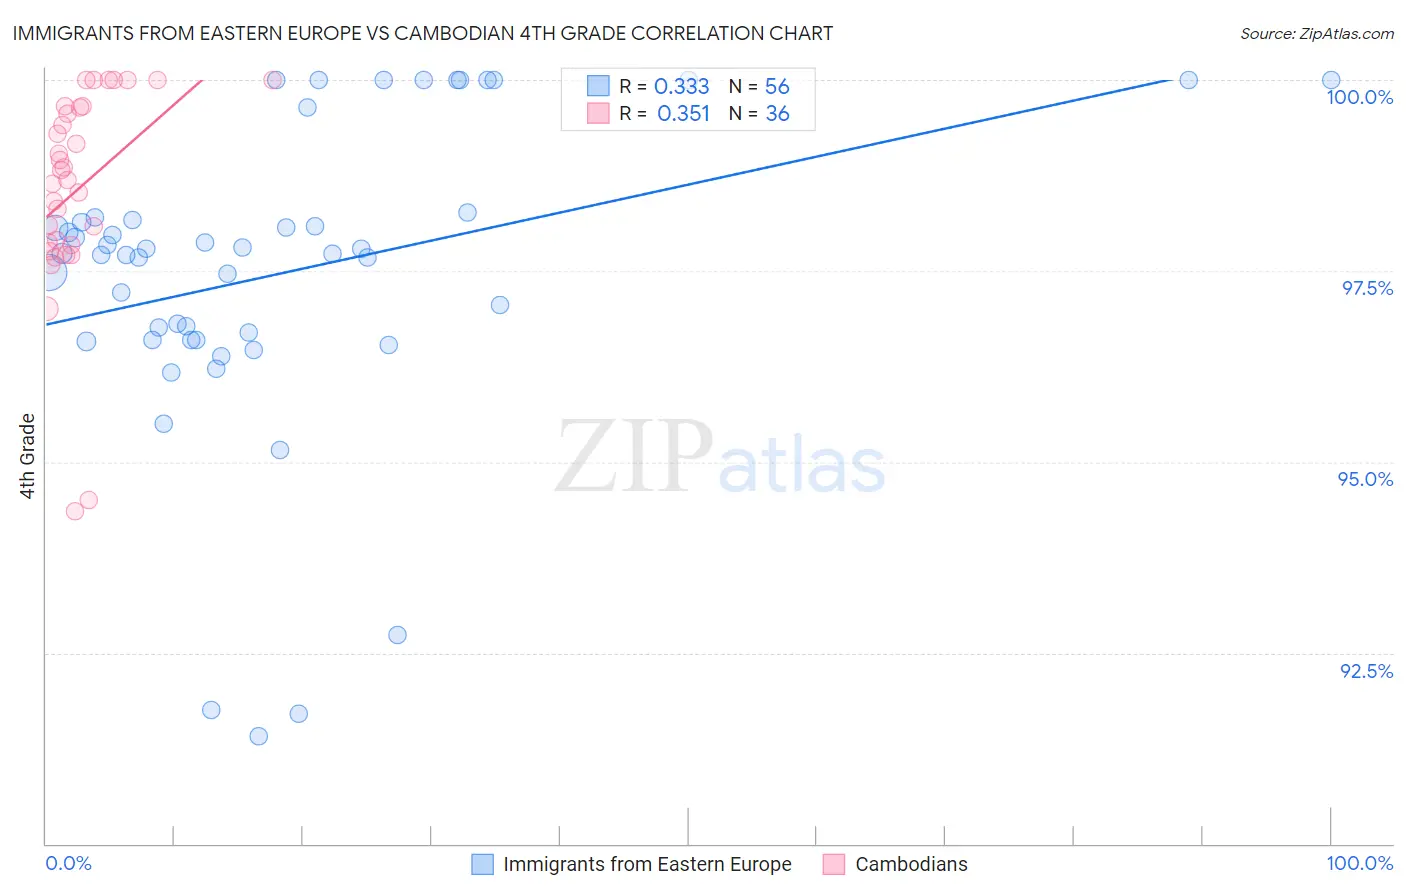
Immigrants from Eastern Europe vs Cambodian 4th Grade Correlation Chart
The statistical analysis conducted on geographies consisting of 475,879,420 people shows a mild positive correlation between the proportion of Immigrants from Eastern Europe and percentage of population with at least 4th grade education in the United States with a correlation coefficient (R) of 0.333 and weighted average of 97.6%. Similarly, the statistical analysis conducted on geographies consisting of 102,511,743 people shows a mild positive correlation between the proportion of Cambodians and percentage of population with at least 4th grade education in the United States with a correlation coefficient (R) of 0.351 and weighted average of 97.7%, a difference of 0.10%.
4th Grade Correlation Summary
| Measurement | Immigrants from Eastern Europe | Cambodian |
| Minimum | 91.4% | 94.4% |
| Maximum | 100.0% | 100.0% |
| Range | 8.6% | 5.6% |
| Mean | 97.5% | 98.6% |
| Median | 97.7% | 98.8% |
| Interquartile 25% (IQ1) | 96.6% | 97.9% |
| Interquartile 75% (IQ3) | 98.2% | 99.6% |
| Interquartile Range (IQR) | 1.6% | 1.8% |
| Standard Deviation (Sample) | 2.0% | 1.3% |
| Standard Deviation (Population) | 2.0% | 1.3% |
Demographics Similar to Immigrants from Eastern Europe and Cambodians by 4th Grade
In terms of 4th grade, the demographic groups most similar to Immigrants from Eastern Europe are Immigrants from South Central Asia (97.6%, a difference of 0.020%), Immigrants from Russia (97.6%, a difference of 0.020%), Soviet Union (97.6%, a difference of 0.030%), Immigrants from Israel (97.6%, a difference of 0.030%), and Alsatian (97.6%, a difference of 0.030%). Similarly, the demographic groups most similar to Cambodians are Palestinian (97.7%, a difference of 0.0%), Israeli (97.7%, a difference of 0.010%), Immigrants from Turkey (97.7%, a difference of 0.020%), Blackfeet (97.7%, a difference of 0.020%), and Seminole (97.7%, a difference of 0.030%).
| Demographics | Rating | Rank | 4th Grade |
| Palestinians | 88.1 /100 | #134 | Excellent 97.7% |
| Cambodians | 87.8 /100 | #135 | Excellent 97.7% |
| Israelis | 86.2 /100 | #136 | Excellent 97.7% |
| Immigrants | Turkey | 86.0 /100 | #137 | Excellent 97.7% |
| Blackfeet | 86.0 /100 | #138 | Excellent 97.7% |
| Seminole | 84.7 /100 | #139 | Excellent 97.7% |
| Filipinos | 84.0 /100 | #140 | Excellent 97.7% |
| Immigrants | Greece | 83.8 /100 | #141 | Excellent 97.7% |
| Immigrants | North Macedonia | 83.3 /100 | #142 | Excellent 97.7% |
| Burmese | 82.8 /100 | #143 | Excellent 97.7% |
| Spaniards | 82.7 /100 | #144 | Excellent 97.7% |
| Immigrants | Moldova | 82.4 /100 | #145 | Excellent 97.7% |
| Jordanians | 81.3 /100 | #146 | Excellent 97.7% |
| Ute | 80.6 /100 | #147 | Excellent 97.7% |
| Hopi | 80.6 /100 | #148 | Excellent 97.7% |
| Soviet Union | 77.8 /100 | #149 | Good 97.6% |
| Immigrants | Israel | 77.7 /100 | #150 | Good 97.6% |
| Alsatians | 77.2 /100 | #151 | Good 97.6% |
| Immigrants | South Central Asia | 76.2 /100 | #152 | Good 97.6% |
| Immigrants | Eastern Europe | 71.3 /100 | #153 | Good 97.6% |
| Immigrants | Russia | 67.0 /100 | #154 | Good 97.6% |