Immigrants from Eastern Europe vs Immigrants from Nepal Disability Age Over 75
COMPARE
Immigrants from Eastern Europe
Immigrants from Nepal
Disability Age Over 75
Disability Age Over 75 Comparison
Immigrants from Eastern Europe
Immigrants from Nepal
46.3%
DISABILITY AGE OVER 75
97.7/ 100
METRIC RATING
100th/ 347
METRIC RANK
46.6%
DISABILITY AGE OVER 75
94.1/ 100
METRIC RATING
120th/ 347
METRIC RANK
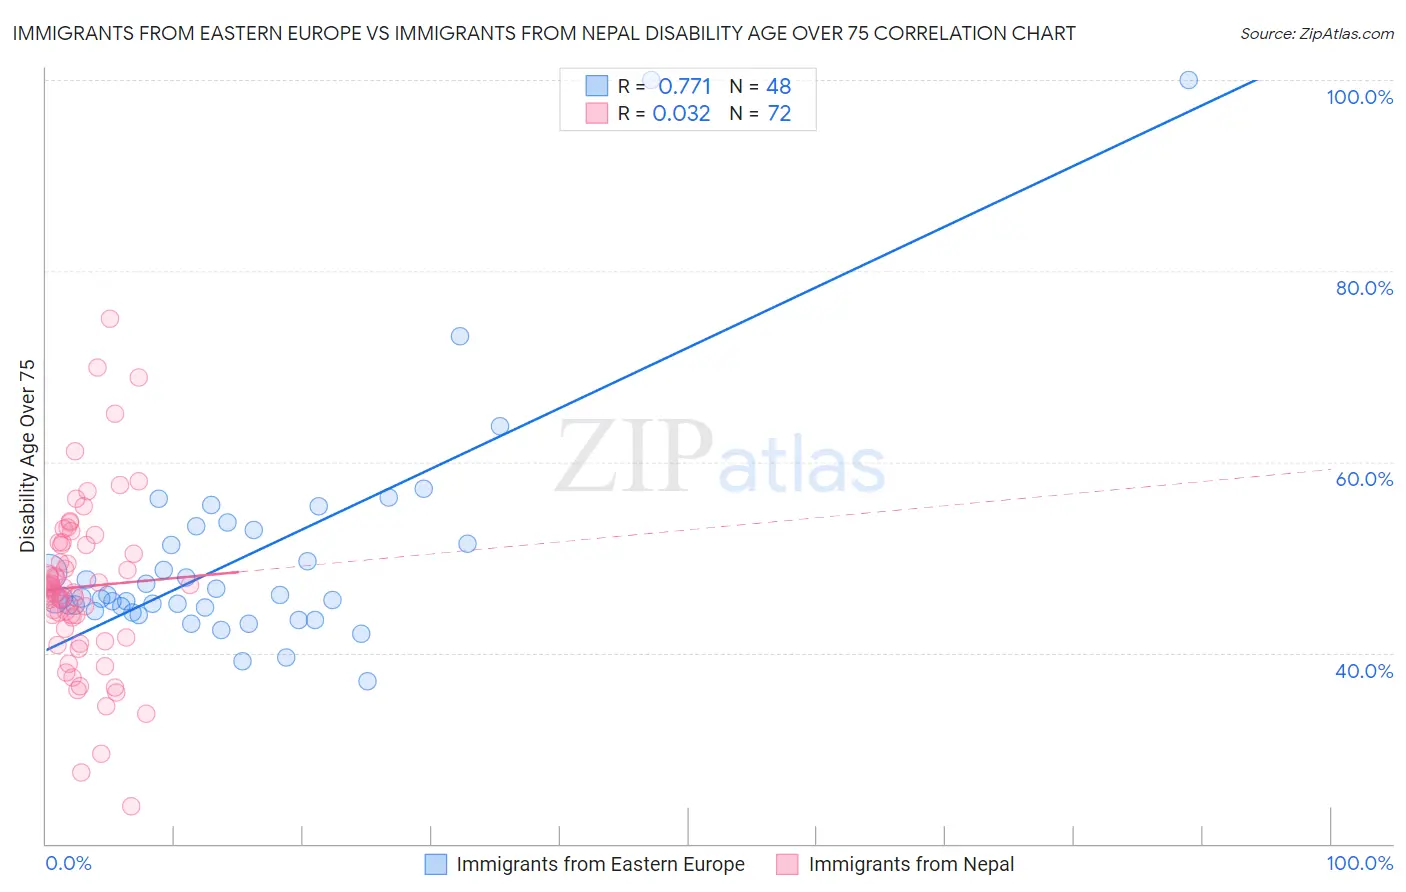
Immigrants from Eastern Europe vs Immigrants from Nepal Disability Age Over 75 Correlation Chart
The statistical analysis conducted on geographies consisting of 474,726,991 people shows a strong positive correlation between the proportion of Immigrants from Eastern Europe and percentage of population with a disability over the age of 75 in the United States with a correlation coefficient (R) of 0.771 and weighted average of 46.3%. Similarly, the statistical analysis conducted on geographies consisting of 186,573,944 people shows no correlation between the proportion of Immigrants from Nepal and percentage of population with a disability over the age of 75 in the United States with a correlation coefficient (R) of 0.032 and weighted average of 46.6%, a difference of 0.55%.
Disability Age Over 75 Correlation Summary
| Measurement | Immigrants from Eastern Europe | Immigrants from Nepal |
| Minimum | 37.1% | 24.0% |
| Maximum | 100.0% | 75.0% |
| Range | 62.9% | 51.0% |
| Mean | 50.1% | 46.9% |
| Median | 45.7% | 46.5% |
| Interquartile 25% (IQ1) | 44.6% | 42.1% |
| Interquartile 75% (IQ3) | 52.1% | 51.4% |
| Interquartile Range (IQR) | 7.6% | 9.3% |
| Standard Deviation (Sample) | 12.3% | 9.0% |
| Standard Deviation (Population) | 12.2% | 8.9% |
Demographics Similar to Immigrants from Eastern Europe and Immigrants from Nepal by Disability Age Over 75
In terms of disability age over 75, the demographic groups most similar to Immigrants from Eastern Europe are Mongolian (46.3%, a difference of 0.0%), Immigrants from Malaysia (46.4%, a difference of 0.12%), Ukrainian (46.4%, a difference of 0.13%), Israeli (46.4%, a difference of 0.14%), and Immigrants from Cameroon (46.4%, a difference of 0.17%). Similarly, the demographic groups most similar to Immigrants from Nepal are Canadian (46.6%, a difference of 0.030%), Czechoslovakian (46.6%, a difference of 0.060%), Hungarian (46.5%, a difference of 0.14%), British (46.5%, a difference of 0.19%), and Indian (Asian) (46.5%, a difference of 0.19%).
| Demographics | Rating | Rank | Disability Age Over 75 |
| Immigrants | Eastern Europe | 97.7 /100 | #100 | Exceptional 46.3% |
| Mongolians | 97.7 /100 | #101 | Exceptional 46.3% |
| Immigrants | Malaysia | 97.1 /100 | #102 | Exceptional 46.4% |
| Ukrainians | 97.1 /100 | #103 | Exceptional 46.4% |
| Israelis | 97.0 /100 | #104 | Exceptional 46.4% |
| Immigrants | Cameroon | 96.9 /100 | #105 | Exceptional 46.4% |
| Immigrants | Kuwait | 96.8 /100 | #106 | Exceptional 46.4% |
| Immigrants | Uruguay | 96.7 /100 | #107 | Exceptional 46.4% |
| Brazilians | 96.6 /100 | #108 | Exceptional 46.5% |
| Chileans | 96.4 /100 | #109 | Exceptional 46.5% |
| Immigrants | Hong Kong | 96.4 /100 | #110 | Exceptional 46.5% |
| Immigrants | Chile | 96.4 /100 | #111 | Exceptional 46.5% |
| Immigrants | Pakistan | 96.1 /100 | #112 | Exceptional 46.5% |
| Irish | 96.0 /100 | #113 | Exceptional 46.5% |
| Dutch | 95.9 /100 | #114 | Exceptional 46.5% |
| British | 95.7 /100 | #115 | Exceptional 46.5% |
| Indians (Asian) | 95.7 /100 | #116 | Exceptional 46.5% |
| Hungarians | 95.3 /100 | #117 | Exceptional 46.5% |
| Czechoslovakians | 94.7 /100 | #118 | Exceptional 46.6% |
| Canadians | 94.4 /100 | #119 | Exceptional 46.6% |
| Immigrants | Nepal | 94.1 /100 | #120 | Exceptional 46.6% |