Immigrants from Switzerland vs Immigrants from Nepal 4th Grade
COMPARE
Immigrants from Switzerland
Immigrants from Nepal
4th Grade
4th Grade Comparison
Immigrants from Switzerland
Immigrants from Nepal
97.8%
4TH GRADE
96.1/ 100
METRIC RATING
111th/ 347
METRIC RANK
97.3%
4TH GRADE
7.7/ 100
METRIC RATING
214th/ 347
METRIC RANK
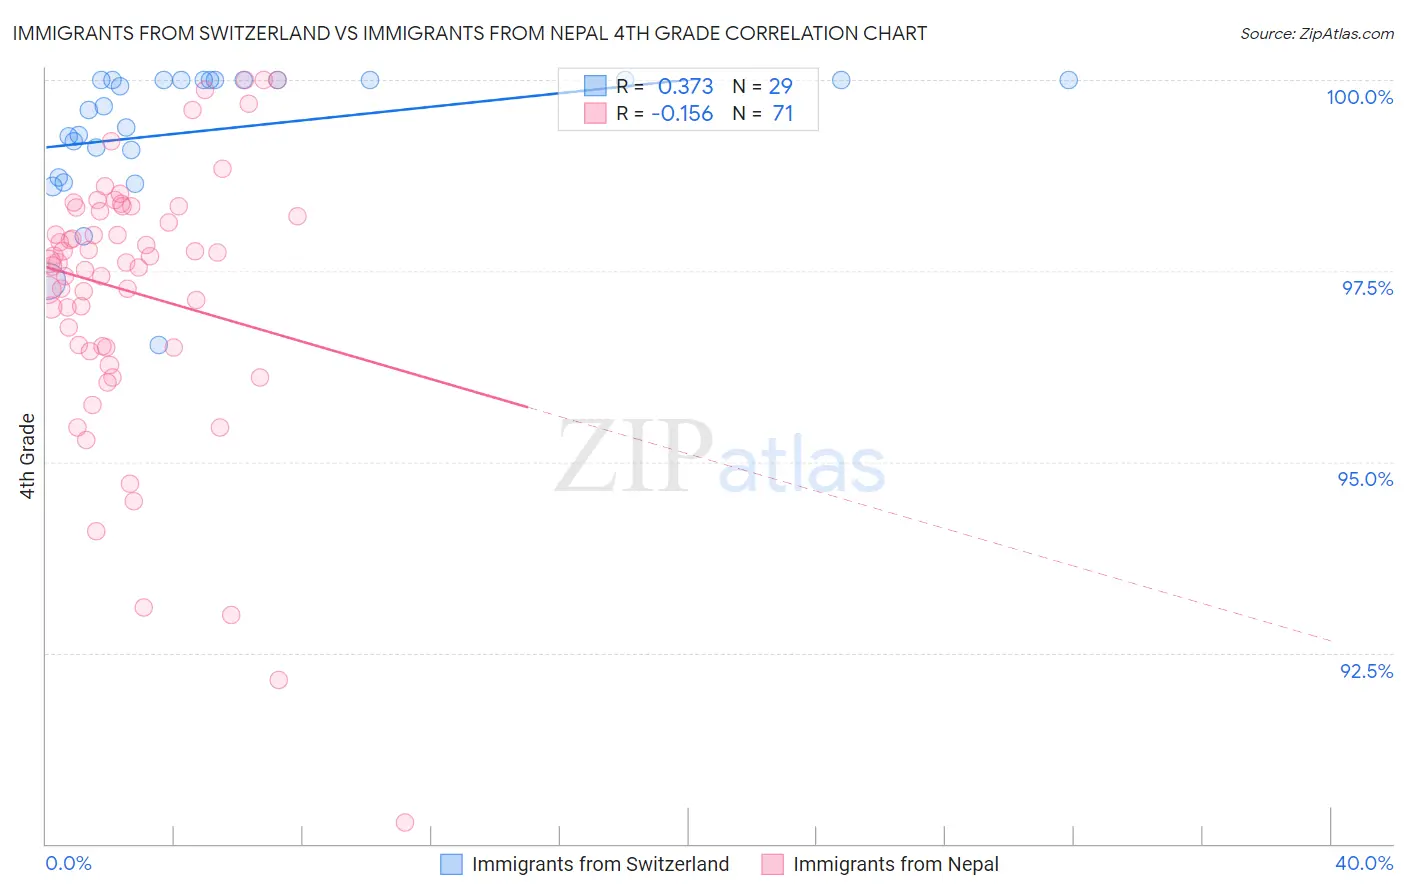
Immigrants from Switzerland vs Immigrants from Nepal 4th Grade Correlation Chart
The statistical analysis conducted on geographies consisting of 148,082,451 people shows a mild positive correlation between the proportion of Immigrants from Switzerland and percentage of population with at least 4th grade education in the United States with a correlation coefficient (R) of 0.373 and weighted average of 97.8%. Similarly, the statistical analysis conducted on geographies consisting of 186,739,570 people shows a poor negative correlation between the proportion of Immigrants from Nepal and percentage of population with at least 4th grade education in the United States with a correlation coefficient (R) of -0.156 and weighted average of 97.3%, a difference of 0.54%.
4th Grade Correlation Summary
| Measurement | Immigrants from Switzerland | Immigrants from Nepal |
| Minimum | 96.5% | 90.3% |
| Maximum | 100.0% | 100.0% |
| Range | 3.5% | 9.7% |
| Mean | 99.3% | 97.2% |
| Median | 99.7% | 97.6% |
| Interquartile 25% (IQ1) | 98.9% | 96.5% |
| Interquartile 75% (IQ3) | 100.0% | 98.3% |
| Interquartile Range (IQR) | 1.1% | 1.8% |
| Standard Deviation (Sample) | 0.88% | 1.8% |
| Standard Deviation (Population) | 0.87% | 1.8% |
Similar Demographics by 4th Grade
Demographics Similar to Immigrants from Switzerland by 4th Grade
In terms of 4th grade, the demographic groups most similar to Immigrants from Switzerland are Okinawan (97.8%, a difference of 0.0%), Thai (97.8%, a difference of 0.010%), Basque (97.8%, a difference of 0.010%), Immigrants from Latvia (97.8%, a difference of 0.020%), and Iroquois (97.8%, a difference of 0.020%).
| Demographics | Rating | Rank | 4th Grade |
| Immigrants | Nonimmigrants | 97.5 /100 | #104 | Exceptional 97.9% |
| German Russians | 97.5 /100 | #105 | Exceptional 97.9% |
| Immigrants | Czechoslovakia | 97.5 /100 | #106 | Exceptional 97.9% |
| Bhutanese | 97.4 /100 | #107 | Exceptional 97.9% |
| Immigrants | Singapore | 97.3 /100 | #108 | Exceptional 97.9% |
| Immigrants | Latvia | 96.8 /100 | #109 | Exceptional 97.8% |
| Thais | 96.7 /100 | #110 | Exceptional 97.8% |
| Immigrants | Switzerland | 96.1 /100 | #111 | Exceptional 97.8% |
| Okinawans | 96.0 /100 | #112 | Exceptional 97.8% |
| Basques | 95.8 /100 | #113 | Exceptional 97.8% |
| Iroquois | 95.4 /100 | #114 | Exceptional 97.8% |
| Lebanese | 95.4 /100 | #115 | Exceptional 97.8% |
| Immigrants | Croatia | 95.2 /100 | #116 | Exceptional 97.8% |
| Syrians | 94.9 /100 | #117 | Exceptional 97.8% |
| Menominee | 94.9 /100 | #118 | Exceptional 97.8% |
Demographics Similar to Immigrants from Nepal by 4th Grade
In terms of 4th grade, the demographic groups most similar to Immigrants from Nepal are Tohono O'odham (97.3%, a difference of 0.010%), Costa Rican (97.3%, a difference of 0.010%), Immigrants from Morocco (97.3%, a difference of 0.010%), Samoan (97.3%, a difference of 0.010%), and Laotian (97.3%, a difference of 0.020%).
| Demographics | Rating | Rank | 4th Grade |
| Moroccans | 11.3 /100 | #207 | Poor 97.3% |
| Immigrants | Bahamas | 10.8 /100 | #208 | Poor 97.3% |
| Laotians | 9.3 /100 | #209 | Tragic 97.3% |
| Immigrants | Oceania | 9.1 /100 | #210 | Tragic 97.3% |
| Sudanese | 9.0 /100 | #211 | Tragic 97.3% |
| Tohono O'odham | 8.4 /100 | #212 | Tragic 97.3% |
| Costa Ricans | 8.3 /100 | #213 | Tragic 97.3% |
| Immigrants | Nepal | 7.7 /100 | #214 | Tragic 97.3% |
| Immigrants | Morocco | 7.1 /100 | #215 | Tragic 97.3% |
| Samoans | 6.8 /100 | #216 | Tragic 97.3% |
| Sierra Leoneans | 6.5 /100 | #217 | Tragic 97.3% |
| Iraqis | 6.3 /100 | #218 | Tragic 97.3% |
| Tongans | 5.8 /100 | #219 | Tragic 97.3% |
| South American Indians | 5.5 /100 | #220 | Tragic 97.3% |
| Immigrants | Panama | 5.4 /100 | #221 | Tragic 97.3% |