Immigrants from Eastern Europe vs Immigrants from Nepal Householder Income Over 65 years
COMPARE
Immigrants from Eastern Europe
Immigrants from Nepal
Householder Income Over 65 years
Householder Income Over 65 years Comparison
Immigrants from Eastern Europe
Immigrants from Nepal
$62,693
HOUSEHOLDER INCOME OVER 65 YEARS
85.9/ 100
METRIC RATING
129th/ 347
METRIC RANK
$61,843
HOUSEHOLDER INCOME OVER 65 YEARS
71.4/ 100
METRIC RATING
147th/ 347
METRIC RANK
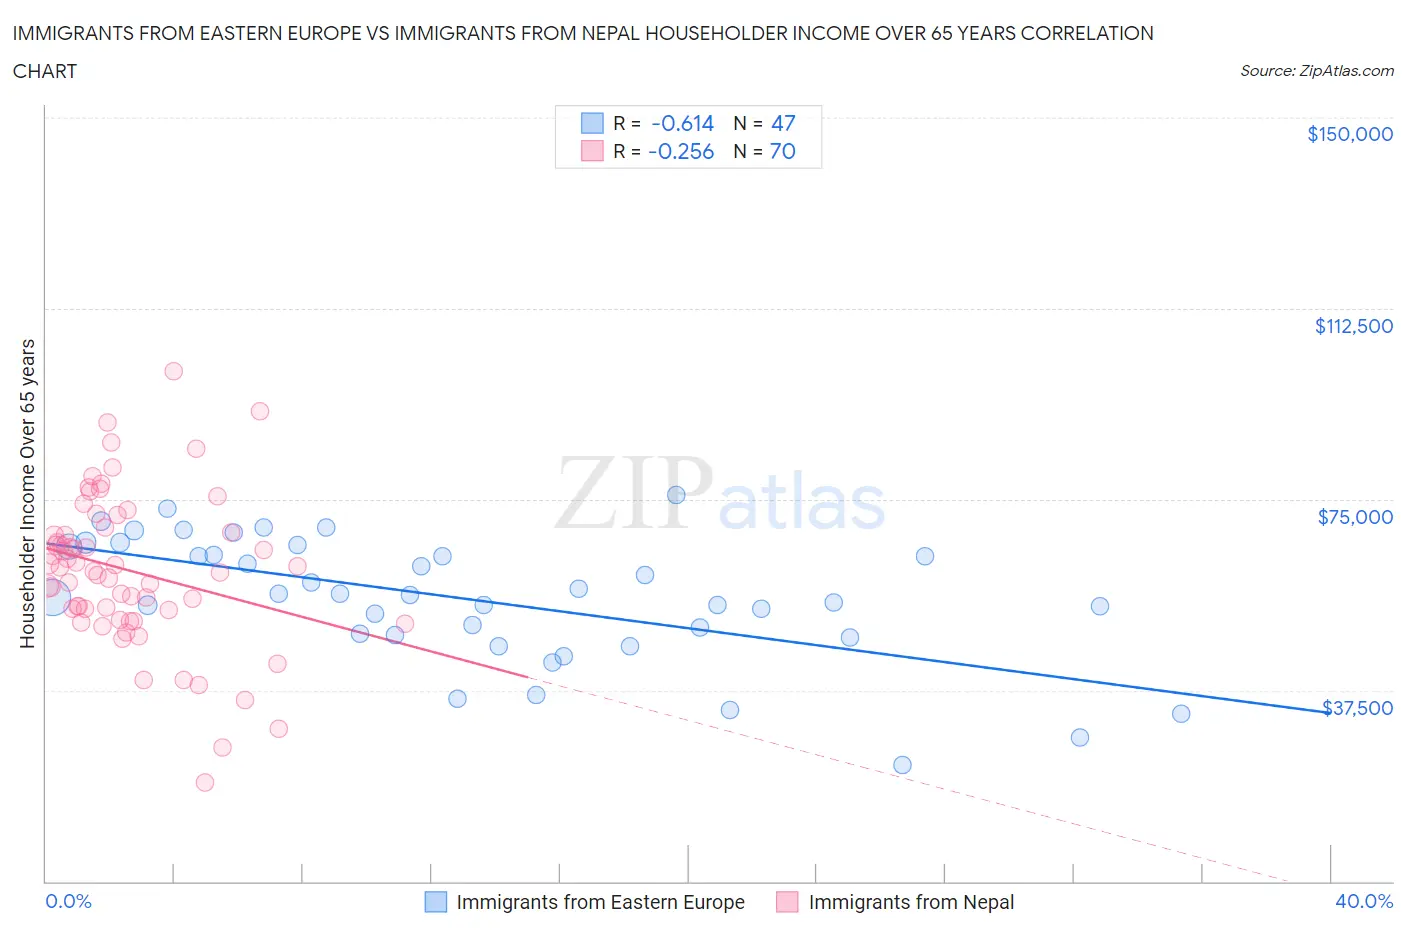
Immigrants from Eastern Europe vs Immigrants from Nepal Householder Income Over 65 years Correlation Chart
The statistical analysis conducted on geographies consisting of 473,577,494 people shows a significant negative correlation between the proportion of Immigrants from Eastern Europe and household income with householder over the age of 65 in the United States with a correlation coefficient (R) of -0.614 and weighted average of $62,693. Similarly, the statistical analysis conducted on geographies consisting of 186,386,270 people shows a weak negative correlation between the proportion of Immigrants from Nepal and household income with householder over the age of 65 in the United States with a correlation coefficient (R) of -0.256 and weighted average of $61,843, a difference of 1.4%.
Householder Income Over 65 years Correlation Summary
| Measurement | Immigrants from Eastern Europe | Immigrants from Nepal |
| Minimum | $22,832 | $19,444 |
| Maximum | $75,833 | $100,278 |
| Range | $53,001 | $80,834 |
| Mean | $55,380 | $60,987 |
| Median | $56,330 | $61,190 |
| Interquartile 25% (IQ1) | $48,435 | $53,317 |
| Interquartile 75% (IQ3) | $65,744 | $68,526 |
| Interquartile Range (IQR) | $17,309 | $15,209 |
| Standard Deviation (Sample) | $12,329 | $14,956 |
| Standard Deviation (Population) | $12,198 | $14,849 |
Demographics Similar to Immigrants from Eastern Europe and Immigrants from Nepal by Householder Income Over 65 years
In terms of householder income over 65 years, the demographic groups most similar to Immigrants from Eastern Europe are Aleut ($62,708, a difference of 0.020%), Basque ($62,653, a difference of 0.060%), Immigrants from Western Asia ($62,645, a difference of 0.080%), Immigrants from Germany ($62,544, a difference of 0.24%), and Immigrants from Northern Africa ($62,522, a difference of 0.27%). Similarly, the demographic groups most similar to Immigrants from Nepal are Alsatian ($61,797, a difference of 0.070%), Immigrants from Southern Europe ($61,902, a difference of 0.10%), Immigrants from Uganda ($61,976, a difference of 0.22%), Immigrants from Peru ($61,988, a difference of 0.23%), and Immigrants from Belarus ($62,162, a difference of 0.52%).
| Demographics | Rating | Rank | Householder Income Over 65 years |
| Aleuts | 86.1 /100 | #128 | Excellent $62,708 |
| Immigrants | Eastern Europe | 85.9 /100 | #129 | Excellent $62,693 |
| Basques | 85.4 /100 | #130 | Excellent $62,653 |
| Immigrants | Western Asia | 85.3 /100 | #131 | Excellent $62,645 |
| Immigrants | Germany | 83.9 /100 | #132 | Excellent $62,544 |
| Immigrants | Northern Africa | 83.6 /100 | #133 | Excellent $62,522 |
| Immigrants | Brazil | 81.2 /100 | #134 | Excellent $62,364 |
| Immigrants | Chile | 81.0 /100 | #135 | Excellent $62,354 |
| Alaskan Athabascans | 80.6 /100 | #136 | Excellent $62,330 |
| Immigrants | Syria | 80.2 /100 | #137 | Excellent $62,303 |
| Immigrants | Kazakhstan | 80.0 /100 | #138 | Excellent $62,292 |
| Lebanese | 79.9 /100 | #139 | Good $62,287 |
| Arabs | 79.6 /100 | #140 | Good $62,266 |
| Canadians | 79.0 /100 | #141 | Good $62,230 |
| South American Indians | 78.7 /100 | #142 | Good $62,215 |
| Immigrants | Belarus | 77.8 /100 | #143 | Good $62,162 |
| Immigrants | Peru | 74.4 /100 | #144 | Good $61,988 |
| Immigrants | Uganda | 74.2 /100 | #145 | Good $61,976 |
| Immigrants | Southern Europe | 72.7 /100 | #146 | Good $61,902 |
| Immigrants | Nepal | 71.4 /100 | #147 | Good $61,843 |
| Alsatians | 70.5 /100 | #148 | Good $61,797 |