Pakistani vs Immigrants from Nepal 4th Grade
COMPARE
Pakistani
Immigrants from Nepal
4th Grade
4th Grade Comparison
Pakistanis
Immigrants from Nepal
97.5%
4TH GRADE
36.2/ 100
METRIC RATING
184th/ 347
METRIC RANK
97.3%
4TH GRADE
7.7/ 100
METRIC RATING
214th/ 347
METRIC RANK
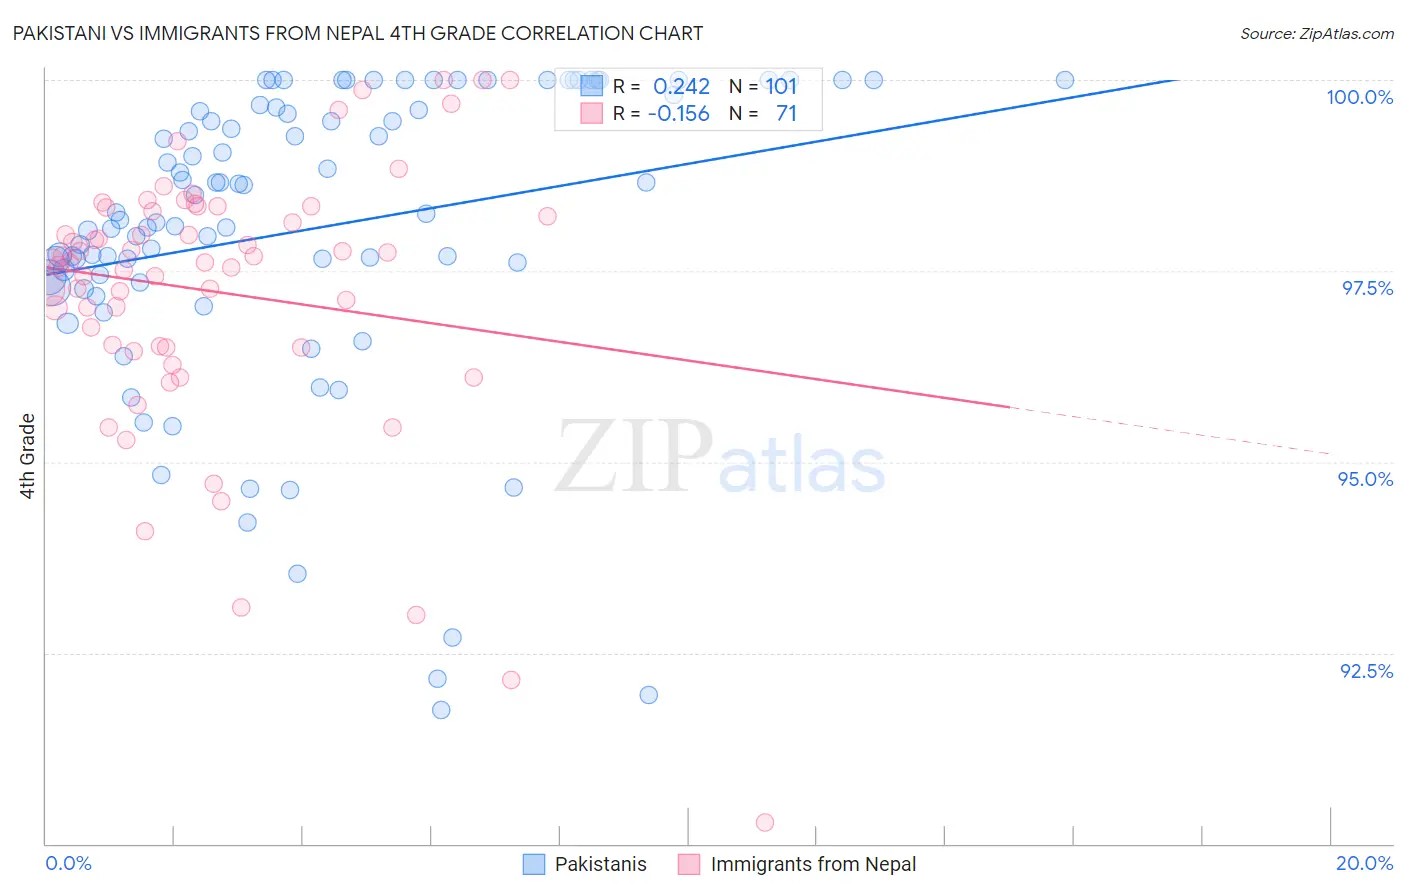
Pakistani vs Immigrants from Nepal 4th Grade Correlation Chart
The statistical analysis conducted on geographies consisting of 335,355,370 people shows a weak positive correlation between the proportion of Pakistanis and percentage of population with at least 4th grade education in the United States with a correlation coefficient (R) of 0.242 and weighted average of 97.5%. Similarly, the statistical analysis conducted on geographies consisting of 186,739,570 people shows a poor negative correlation between the proportion of Immigrants from Nepal and percentage of population with at least 4th grade education in the United States with a correlation coefficient (R) of -0.156 and weighted average of 97.3%, a difference of 0.18%.
4th Grade Correlation Summary
| Measurement | Pakistani | Immigrants from Nepal |
| Minimum | 91.8% | 90.3% |
| Maximum | 100.0% | 100.0% |
| Range | 8.2% | 9.7% |
| Mean | 98.0% | 97.2% |
| Median | 98.2% | 97.6% |
| Interquartile 25% (IQ1) | 97.4% | 96.5% |
| Interquartile 75% (IQ3) | 99.7% | 98.3% |
| Interquartile Range (IQR) | 2.3% | 1.8% |
| Standard Deviation (Sample) | 2.0% | 1.8% |
| Standard Deviation (Population) | 2.0% | 1.8% |
Similar Demographics by 4th Grade
Demographics Similar to Pakistanis by 4th Grade
In terms of 4th grade, the demographic groups most similar to Pakistanis are Immigrants from Kenya (97.5%, a difference of 0.0%), Dutch West Indian (97.5%, a difference of 0.0%), Spanish American (97.5%, a difference of 0.010%), Argentinean (97.5%, a difference of 0.010%), and Mongolian (97.5%, a difference of 0.010%).
| Demographics | Rating | Rank | 4th Grade |
| Immigrants | Brazil | 46.1 /100 | #177 | Average 97.5% |
| Comanche | 45.3 /100 | #178 | Average 97.5% |
| Immigrants | Kazakhstan | 43.6 /100 | #179 | Average 97.5% |
| Immigrants | Venezuela | 42.7 /100 | #180 | Average 97.5% |
| Immigrants | Taiwan | 41.5 /100 | #181 | Average 97.5% |
| Spanish Americans | 39.3 /100 | #182 | Fair 97.5% |
| Argentineans | 39.0 /100 | #183 | Fair 97.5% |
| Pakistanis | 36.2 /100 | #184 | Fair 97.5% |
| Immigrants | Kenya | 35.8 /100 | #185 | Fair 97.5% |
| Dutch West Indians | 35.8 /100 | #186 | Fair 97.5% |
| Mongolians | 34.7 /100 | #187 | Fair 97.5% |
| Immigrants | Argentina | 34.6 /100 | #188 | Fair 97.5% |
| Panamanians | 31.9 /100 | #189 | Fair 97.4% |
| Blacks/African Americans | 31.1 /100 | #190 | Fair 97.4% |
| Navajo | 30.7 /100 | #191 | Fair 97.4% |
Demographics Similar to Immigrants from Nepal by 4th Grade
In terms of 4th grade, the demographic groups most similar to Immigrants from Nepal are Tohono O'odham (97.3%, a difference of 0.010%), Costa Rican (97.3%, a difference of 0.010%), Immigrants from Morocco (97.3%, a difference of 0.010%), Samoan (97.3%, a difference of 0.010%), and Laotian (97.3%, a difference of 0.020%).
| Demographics | Rating | Rank | 4th Grade |
| Moroccans | 11.3 /100 | #207 | Poor 97.3% |
| Immigrants | Bahamas | 10.8 /100 | #208 | Poor 97.3% |
| Laotians | 9.3 /100 | #209 | Tragic 97.3% |
| Immigrants | Oceania | 9.1 /100 | #210 | Tragic 97.3% |
| Sudanese | 9.0 /100 | #211 | Tragic 97.3% |
| Tohono O'odham | 8.4 /100 | #212 | Tragic 97.3% |
| Costa Ricans | 8.3 /100 | #213 | Tragic 97.3% |
| Immigrants | Nepal | 7.7 /100 | #214 | Tragic 97.3% |
| Immigrants | Morocco | 7.1 /100 | #215 | Tragic 97.3% |
| Samoans | 6.8 /100 | #216 | Tragic 97.3% |
| Sierra Leoneans | 6.5 /100 | #217 | Tragic 97.3% |
| Iraqis | 6.3 /100 | #218 | Tragic 97.3% |
| Tongans | 5.8 /100 | #219 | Tragic 97.3% |
| South American Indians | 5.5 /100 | #220 | Tragic 97.3% |
| Immigrants | Panama | 5.4 /100 | #221 | Tragic 97.3% |