Immigrants from Dominican Republic vs Apache Master's Degree
COMPARE
Immigrants from Dominican Republic
Apache
Master's Degree
Master's Degree Comparison
Immigrants from Dominican Republic
Apache
12.1%
MASTER'S DEGREE
0.2/ 100
METRIC RATING
280th/ 347
METRIC RANK
11.0%
MASTER'S DEGREE
0.0/ 100
METRIC RATING
315th/ 347
METRIC RANK
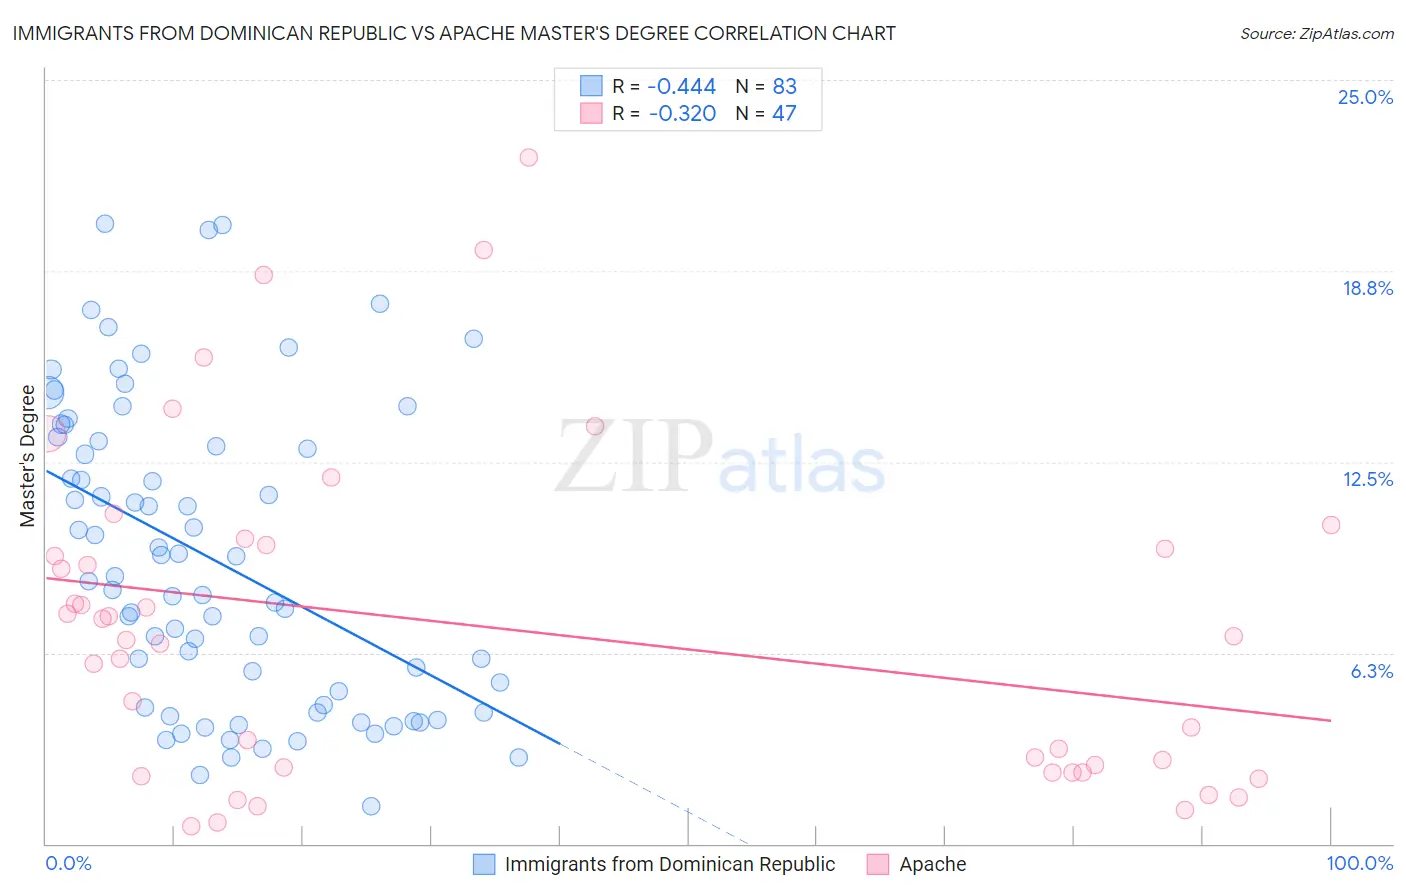
Immigrants from Dominican Republic vs Apache Master's Degree Correlation Chart
The statistical analysis conducted on geographies consisting of 275,069,954 people shows a moderate negative correlation between the proportion of Immigrants from Dominican Republic and percentage of population with at least master's degree education in the United States with a correlation coefficient (R) of -0.444 and weighted average of 12.1%. Similarly, the statistical analysis conducted on geographies consisting of 231,057,413 people shows a mild negative correlation between the proportion of Apache and percentage of population with at least master's degree education in the United States with a correlation coefficient (R) of -0.320 and weighted average of 11.0%, a difference of 9.9%.
Master's Degree Correlation Summary
| Measurement | Immigrants from Dominican Republic | Apache |
| Minimum | 1.2% | 0.59% |
| Maximum | 20.3% | 22.5% |
| Range | 19.1% | 21.9% |
| Mean | 9.3% | 7.0% |
| Median | 8.6% | 6.7% |
| Interquartile 25% (IQ1) | 4.4% | 2.3% |
| Interquartile 75% (IQ3) | 13.2% | 9.8% |
| Interquartile Range (IQR) | 8.7% | 7.4% |
| Standard Deviation (Sample) | 4.9% | 5.3% |
| Standard Deviation (Population) | 4.9% | 5.3% |
Similar Demographics by Master's Degree
Demographics Similar to Immigrants from Dominican Republic by Master's Degree
In terms of master's degree, the demographic groups most similar to Immigrants from Dominican Republic are Immigrants from Belize (12.1%, a difference of 0.060%), Malaysian (12.0%, a difference of 0.12%), Potawatomi (12.1%, a difference of 0.13%), Immigrants from Caribbean (12.1%, a difference of 0.14%), and Black/African American (12.1%, a difference of 0.15%).
| Demographics | Rating | Rank | Master's Degree |
| Blackfeet | 0.3 /100 | #273 | Tragic 12.1% |
| Cape Verdeans | 0.3 /100 | #274 | Tragic 12.1% |
| Cubans | 0.3 /100 | #275 | Tragic 12.1% |
| Blacks/African Americans | 0.3 /100 | #276 | Tragic 12.1% |
| Immigrants | Caribbean | 0.3 /100 | #277 | Tragic 12.1% |
| Potawatomi | 0.3 /100 | #278 | Tragic 12.1% |
| Immigrants | Belize | 0.2 /100 | #279 | Tragic 12.1% |
| Immigrants | Dominican Republic | 0.2 /100 | #280 | Tragic 12.1% |
| Malaysians | 0.2 /100 | #281 | Tragic 12.0% |
| Immigrants | El Salvador | 0.2 /100 | #282 | Tragic 12.0% |
| Hondurans | 0.2 /100 | #283 | Tragic 11.9% |
| Ottawa | 0.2 /100 | #284 | Tragic 11.9% |
| Immigrants | Nicaragua | 0.2 /100 | #285 | Tragic 11.8% |
| Aleuts | 0.1 /100 | #286 | Tragic 11.8% |
| Immigrants | Haiti | 0.1 /100 | #287 | Tragic 11.8% |
Demographics Similar to Apache by Master's Degree
In terms of master's degree, the demographic groups most similar to Apache are Cajun (11.0%, a difference of 0.0%), Hispanic or Latino (10.9%, a difference of 0.34%), Yaqui (11.0%, a difference of 0.40%), Choctaw (11.0%, a difference of 0.58%), and Seminole (11.0%, a difference of 0.67%).
| Demographics | Rating | Rank | Master's Degree |
| Puerto Ricans | 0.0 /100 | #308 | Tragic 11.2% |
| Puget Sound Salish | 0.0 /100 | #309 | Tragic 11.1% |
| Shoshone | 0.0 /100 | #310 | Tragic 11.1% |
| Seminole | 0.0 /100 | #311 | Tragic 11.0% |
| Choctaw | 0.0 /100 | #312 | Tragic 11.0% |
| Yaqui | 0.0 /100 | #313 | Tragic 11.0% |
| Cajuns | 0.0 /100 | #314 | Tragic 11.0% |
| Apache | 0.0 /100 | #315 | Tragic 11.0% |
| Hispanics or Latinos | 0.0 /100 | #316 | Tragic 10.9% |
| Hopi | 0.0 /100 | #317 | Tragic 10.9% |
| Immigrants | Cuba | 0.0 /100 | #318 | Tragic 10.9% |
| Kiowa | 0.0 /100 | #319 | Tragic 10.8% |
| Immigrants | Micronesia | 0.0 /100 | #320 | Tragic 10.8% |
| Pennsylvania Germans | 0.0 /100 | #321 | Tragic 10.7% |
| Sioux | 0.0 /100 | #322 | Tragic 10.7% |