Immigrants from Dominican Republic vs Zimbabwean Vision Disability
COMPARE
Immigrants from Dominican Republic
Zimbabwean
Vision Disability
Vision Disability Comparison
Immigrants from Dominican Republic
Zimbabweans
2.6%
VISION DISABILITY
0.0/ 100
METRIC RATING
307th/ 347
METRIC RANK
2.0%
VISION DISABILITY
99.7/ 100
METRIC RATING
39th/ 347
METRIC RANK
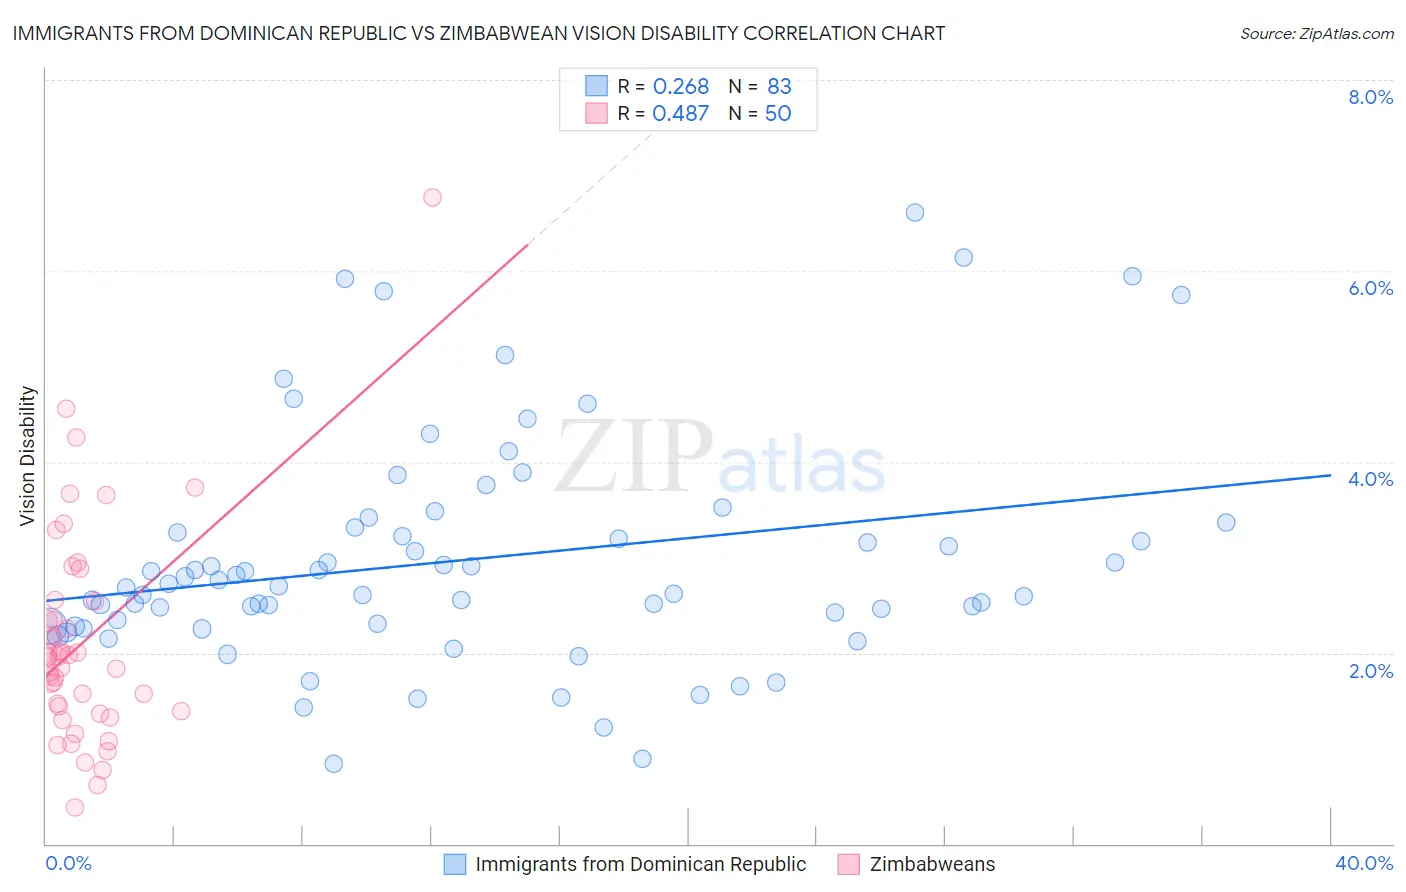
Immigrants from Dominican Republic vs Zimbabwean Vision Disability Correlation Chart
The statistical analysis conducted on geographies consisting of 274,988,247 people shows a weak positive correlation between the proportion of Immigrants from Dominican Republic and percentage of population with vision disability in the United States with a correlation coefficient (R) of 0.268 and weighted average of 2.6%. Similarly, the statistical analysis conducted on geographies consisting of 69,201,681 people shows a moderate positive correlation between the proportion of Zimbabweans and percentage of population with vision disability in the United States with a correlation coefficient (R) of 0.487 and weighted average of 2.0%, a difference of 33.0%.
Vision Disability Correlation Summary
| Measurement | Immigrants from Dominican Republic | Zimbabwean |
| Minimum | 0.84% | 0.38% |
| Maximum | 6.6% | 6.8% |
| Range | 5.8% | 6.4% |
| Mean | 3.0% | 2.1% |
| Median | 2.7% | 2.0% |
| Interquartile 25% (IQ1) | 2.3% | 1.4% |
| Interquartile 75% (IQ3) | 3.3% | 2.5% |
| Interquartile Range (IQR) | 1.0% | 1.2% |
| Standard Deviation (Sample) | 1.2% | 1.1% |
| Standard Deviation (Population) | 1.2% | 1.1% |
Similar Demographics by Vision Disability
Demographics Similar to Immigrants from Dominican Republic by Vision Disability
In terms of vision disability, the demographic groups most similar to Immigrants from Dominican Republic are Iroquois (2.6%, a difference of 0.020%), Arapaho (2.6%, a difference of 0.020%), Immigrants from Yemen (2.6%, a difference of 0.30%), Blackfeet (2.6%, a difference of 0.63%), and Hispanic or Latino (2.6%, a difference of 0.64%).
| Demographics | Rating | Rank | Vision Disability |
| Africans | 0.0 /100 | #300 | Tragic 2.5% |
| Menominee | 0.0 /100 | #301 | Tragic 2.5% |
| Spanish American Indians | 0.0 /100 | #302 | Tragic 2.6% |
| Immigrants | Cabo Verde | 0.0 /100 | #303 | Tragic 2.6% |
| Aleuts | 0.0 /100 | #304 | Tragic 2.6% |
| Hispanics or Latinos | 0.0 /100 | #305 | Tragic 2.6% |
| Iroquois | 0.0 /100 | #306 | Tragic 2.6% |
| Immigrants | Dominican Republic | 0.0 /100 | #307 | Tragic 2.6% |
| Arapaho | 0.0 /100 | #308 | Tragic 2.6% |
| Immigrants | Yemen | 0.0 /100 | #309 | Tragic 2.6% |
| Blackfeet | 0.0 /100 | #310 | Tragic 2.6% |
| Dominicans | 0.0 /100 | #311 | Tragic 2.6% |
| Americans | 0.0 /100 | #312 | Tragic 2.6% |
| Potawatomi | 0.0 /100 | #313 | Tragic 2.6% |
| Inupiat | 0.0 /100 | #314 | Tragic 2.7% |
Demographics Similar to Zimbabweans by Vision Disability
In terms of vision disability, the demographic groups most similar to Zimbabweans are Immigrants from Kuwait (2.0%, a difference of 0.060%), Bhutanese (2.0%, a difference of 0.090%), Immigrants from Ireland (2.0%, a difference of 0.20%), Cypriot (2.0%, a difference of 0.22%), and Cambodian (2.0%, a difference of 0.34%).
| Demographics | Rating | Rank | Vision Disability |
| Luxembourgers | 99.9 /100 | #32 | Exceptional 1.9% |
| Immigrants | Egypt | 99.9 /100 | #33 | Exceptional 1.9% |
| Immigrants | Turkey | 99.8 /100 | #34 | Exceptional 1.9% |
| Immigrants | Australia | 99.8 /100 | #35 | Exceptional 1.9% |
| Cambodians | 99.8 /100 | #36 | Exceptional 2.0% |
| Bhutanese | 99.8 /100 | #37 | Exceptional 2.0% |
| Immigrants | Kuwait | 99.8 /100 | #38 | Exceptional 2.0% |
| Zimbabweans | 99.7 /100 | #39 | Exceptional 2.0% |
| Immigrants | Ireland | 99.7 /100 | #40 | Exceptional 2.0% |
| Cypriots | 99.7 /100 | #41 | Exceptional 2.0% |
| Immigrants | Ethiopia | 99.7 /100 | #42 | Exceptional 2.0% |
| Eastern Europeans | 99.7 /100 | #43 | Exceptional 2.0% |
| Immigrants | Indonesia | 99.7 /100 | #44 | Exceptional 2.0% |
| Ethiopians | 99.7 /100 | #45 | Exceptional 2.0% |
| Immigrants | Sweden | 99.7 /100 | #46 | Exceptional 2.0% |