Immigrants from Dominica vs Immigrants from Honduras College, Under 1 year
COMPARE
Immigrants from Dominica
Immigrants from Honduras
College, Under 1 year
College, Under 1 year Comparison
Immigrants from Dominica
Immigrants from Honduras
57.9%
COLLEGE, UNDER 1 YEAR
0.0/ 100
METRIC RATING
303rd/ 347
METRIC RANK
56.5%
COLLEGE, UNDER 1 YEAR
0.0/ 100
METRIC RATING
323rd/ 347
METRIC RANK
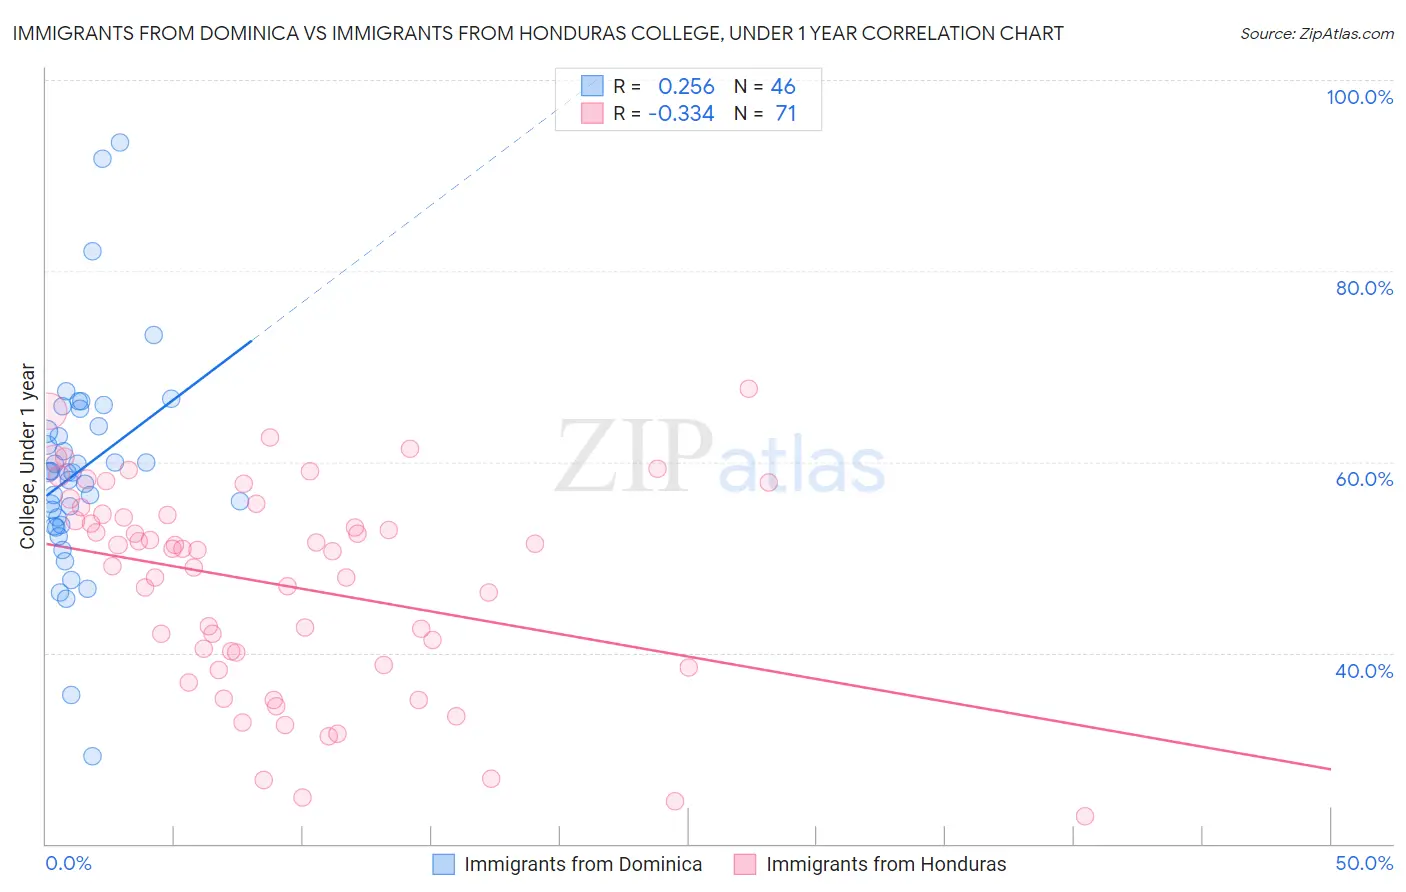
Immigrants from Dominica vs Immigrants from Honduras College, Under 1 year Correlation Chart
The statistical analysis conducted on geographies consisting of 83,796,433 people shows a weak positive correlation between the proportion of Immigrants from Dominica and percentage of population with at least college, under 1 year education in the United States with a correlation coefficient (R) of 0.256 and weighted average of 57.9%. Similarly, the statistical analysis conducted on geographies consisting of 322,637,196 people shows a mild negative correlation between the proportion of Immigrants from Honduras and percentage of population with at least college, under 1 year education in the United States with a correlation coefficient (R) of -0.334 and weighted average of 56.5%, a difference of 2.5%.
College, Under 1 year Correlation Summary
| Measurement | Immigrants from Dominica | Immigrants from Honduras |
| Minimum | 29.1% | 22.9% |
| Maximum | 93.5% | 67.7% |
| Range | 64.4% | 44.7% |
| Mean | 59.1% | 47.1% |
| Median | 58.9% | 50.8% |
| Interquartile 25% (IQ1) | 53.3% | 38.7% |
| Interquartile 75% (IQ3) | 63.7% | 54.5% |
| Interquartile Range (IQR) | 10.4% | 15.8% |
| Standard Deviation (Sample) | 11.4% | 10.8% |
| Standard Deviation (Population) | 11.3% | 10.7% |
Demographics Similar to Immigrants from Dominica and Immigrants from Honduras by College, Under 1 year
In terms of college, under 1 year, the demographic groups most similar to Immigrants from Dominica are Kiowa (57.8%, a difference of 0.010%), Haitian (57.8%, a difference of 0.12%), Immigrants from Portugal (57.7%, a difference of 0.32%), Fijian (57.7%, a difference of 0.34%), and Central American (57.7%, a difference of 0.34%). Similarly, the demographic groups most similar to Immigrants from Honduras are Immigrants from Caribbean (56.6%, a difference of 0.18%), Native/Alaskan (56.6%, a difference of 0.31%), Guatemalan (56.8%, a difference of 0.57%), Puerto Rican (56.8%, a difference of 0.63%), and Immigrants from Haiti (56.9%, a difference of 0.84%).
| Demographics | Rating | Rank | College, Under 1 year |
| Immigrants | Dominica | 0.0 /100 | #303 | Tragic 57.9% |
| Kiowa | 0.0 /100 | #304 | Tragic 57.8% |
| Haitians | 0.0 /100 | #305 | Tragic 57.8% |
| Immigrants | Portugal | 0.0 /100 | #306 | Tragic 57.7% |
| Fijians | 0.0 /100 | #307 | Tragic 57.7% |
| Central Americans | 0.0 /100 | #308 | Tragic 57.7% |
| Immigrants | Nicaragua | 0.0 /100 | #309 | Tragic 57.6% |
| Pueblo | 0.0 /100 | #310 | Tragic 57.4% |
| Cajuns | 0.0 /100 | #311 | Tragic 57.3% |
| Salvadorans | 0.0 /100 | #312 | Tragic 57.3% |
| Dutch West Indians | 0.0 /100 | #313 | Tragic 57.2% |
| Hopi | 0.0 /100 | #314 | Tragic 57.1% |
| Hondurans | 0.0 /100 | #315 | Tragic 57.1% |
| Menominee | 0.0 /100 | #316 | Tragic 57.0% |
| Hispanics or Latinos | 0.0 /100 | #317 | Tragic 57.0% |
| Immigrants | Haiti | 0.0 /100 | #318 | Tragic 56.9% |
| Puerto Ricans | 0.0 /100 | #319 | Tragic 56.8% |
| Guatemalans | 0.0 /100 | #320 | Tragic 56.8% |
| Natives/Alaskans | 0.0 /100 | #321 | Tragic 56.6% |
| Immigrants | Caribbean | 0.0 /100 | #322 | Tragic 56.6% |
| Immigrants | Honduras | 0.0 /100 | #323 | Tragic 56.5% |