Immigrants from Dominica vs Immigrants from South Eastern Asia College, Under 1 year
COMPARE
Immigrants from Dominica
Immigrants from South Eastern Asia
College, Under 1 year
College, Under 1 year Comparison
Immigrants from Dominica
Immigrants from South Eastern Asia
57.9%
COLLEGE, UNDER 1 YEAR
0.0/ 100
METRIC RATING
303rd/ 347
METRIC RANK
64.5%
COLLEGE, UNDER 1 YEAR
22.1/ 100
METRIC RATING
195th/ 347
METRIC RANK
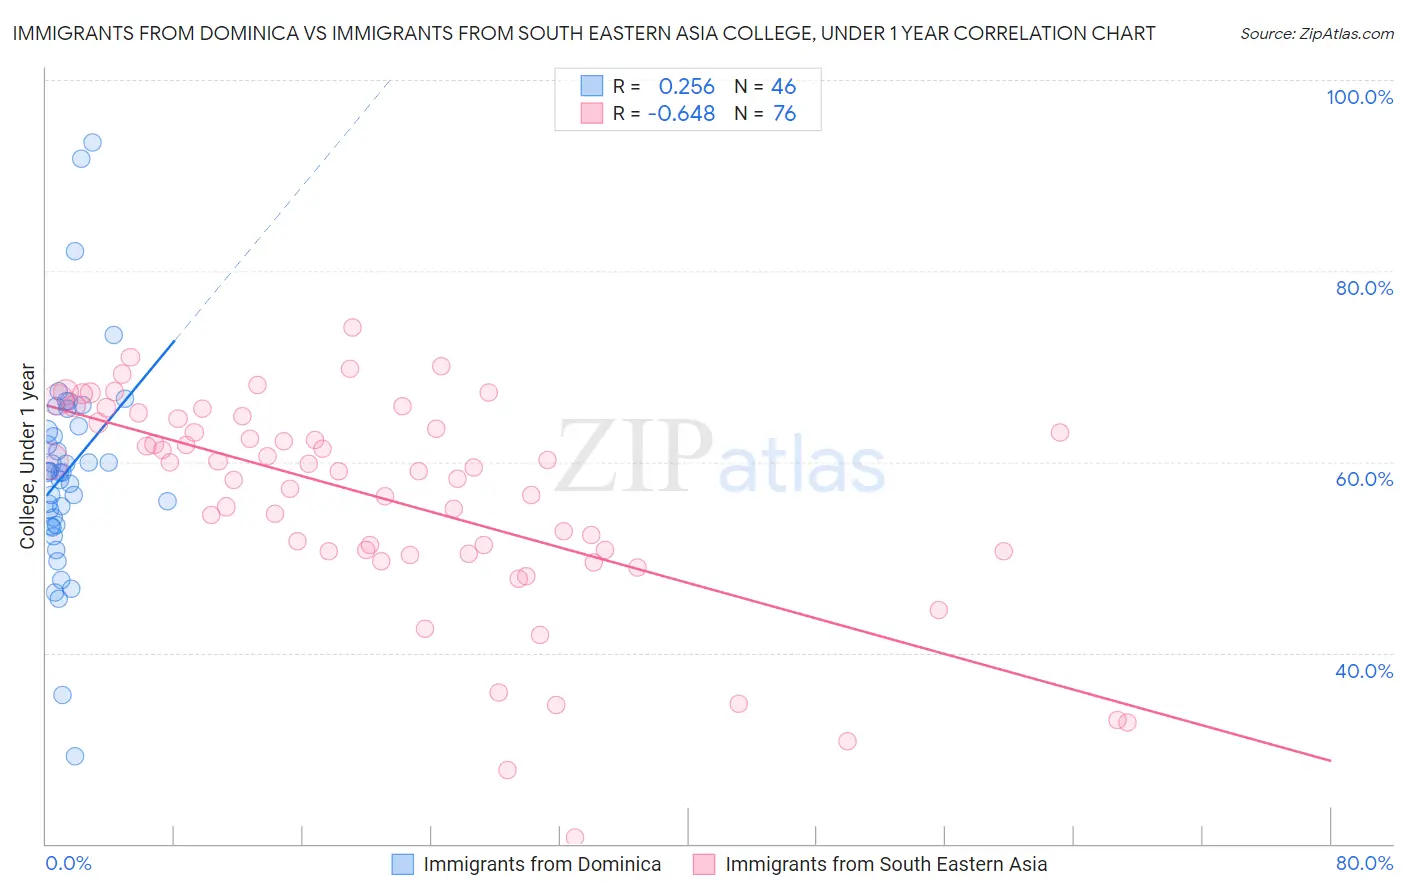
Immigrants from Dominica vs Immigrants from South Eastern Asia College, Under 1 year Correlation Chart
The statistical analysis conducted on geographies consisting of 83,796,433 people shows a weak positive correlation between the proportion of Immigrants from Dominica and percentage of population with at least college, under 1 year education in the United States with a correlation coefficient (R) of 0.256 and weighted average of 57.9%. Similarly, the statistical analysis conducted on geographies consisting of 512,706,379 people shows a significant negative correlation between the proportion of Immigrants from South Eastern Asia and percentage of population with at least college, under 1 year education in the United States with a correlation coefficient (R) of -0.648 and weighted average of 64.5%, a difference of 11.5%.
College, Under 1 year Correlation Summary
| Measurement | Immigrants from Dominica | Immigrants from South Eastern Asia |
| Minimum | 29.1% | 20.7% |
| Maximum | 93.5% | 74.1% |
| Range | 64.4% | 53.4% |
| Mean | 59.1% | 56.1% |
| Median | 58.9% | 59.2% |
| Interquartile 25% (IQ1) | 53.3% | 50.7% |
| Interquartile 75% (IQ3) | 63.7% | 64.3% |
| Interquartile Range (IQR) | 10.4% | 13.7% |
| Standard Deviation (Sample) | 11.4% | 11.2% |
| Standard Deviation (Population) | 11.3% | 11.1% |
Similar Demographics by College, Under 1 year
Demographics Similar to Immigrants from Dominica by College, Under 1 year
In terms of college, under 1 year, the demographic groups most similar to Immigrants from Dominica are Kiowa (57.8%, a difference of 0.010%), Haitian (57.8%, a difference of 0.12%), Apache (58.0%, a difference of 0.29%), Immigrants from Portugal (57.7%, a difference of 0.32%), and Fijian (57.7%, a difference of 0.34%).
| Demographics | Rating | Rank | College, Under 1 year |
| Central American Indians | 0.0 /100 | #296 | Tragic 59.0% |
| Guyanese | 0.0 /100 | #297 | Tragic 59.0% |
| Immigrants | Ecuador | 0.0 /100 | #298 | Tragic 58.7% |
| Cubans | 0.0 /100 | #299 | Tragic 58.6% |
| Immigrants | Guyana | 0.0 /100 | #300 | Tragic 58.5% |
| Mexican American Indians | 0.0 /100 | #301 | Tragic 58.1% |
| Apache | 0.0 /100 | #302 | Tragic 58.0% |
| Immigrants | Dominica | 0.0 /100 | #303 | Tragic 57.9% |
| Kiowa | 0.0 /100 | #304 | Tragic 57.8% |
| Haitians | 0.0 /100 | #305 | Tragic 57.8% |
| Immigrants | Portugal | 0.0 /100 | #306 | Tragic 57.7% |
| Fijians | 0.0 /100 | #307 | Tragic 57.7% |
| Central Americans | 0.0 /100 | #308 | Tragic 57.7% |
| Immigrants | Nicaragua | 0.0 /100 | #309 | Tragic 57.6% |
| Pueblo | 0.0 /100 | #310 | Tragic 57.4% |
Demographics Similar to Immigrants from South Eastern Asia by College, Under 1 year
In terms of college, under 1 year, the demographic groups most similar to Immigrants from South Eastern Asia are Tongan (64.5%, a difference of 0.050%), Immigrants from Cameroon (64.6%, a difference of 0.16%), Costa Rican (64.4%, a difference of 0.17%), Slovak (64.7%, a difference of 0.28%), and Immigrants from Thailand (64.7%, a difference of 0.30%).
| Demographics | Rating | Rank | College, Under 1 year |
| Immigrants | Albania | 32.0 /100 | #188 | Fair 64.9% |
| Spanish | 31.6 /100 | #189 | Fair 64.9% |
| Immigrants | Philippines | 30.1 /100 | #190 | Fair 64.8% |
| Immigrants | Armenia | 28.1 /100 | #191 | Fair 64.7% |
| Immigrants | Thailand | 27.0 /100 | #192 | Fair 64.7% |
| Slovaks | 26.7 /100 | #193 | Fair 64.7% |
| Immigrants | Cameroon | 24.6 /100 | #194 | Fair 64.6% |
| Immigrants | South Eastern Asia | 22.1 /100 | #195 | Fair 64.5% |
| Tongans | 21.2 /100 | #196 | Fair 64.5% |
| Costa Ricans | 19.6 /100 | #197 | Poor 64.4% |
| Tsimshian | 17.9 /100 | #198 | Poor 64.3% |
| Panamanians | 17.0 /100 | #199 | Poor 64.3% |
| Nigerians | 16.7 /100 | #200 | Poor 64.3% |
| French Canadians | 16.3 /100 | #201 | Poor 64.2% |
| South Americans | 16.2 /100 | #202 | Poor 64.2% |