Immigrants from Dominica vs Asian Male Unemployment
COMPARE
Immigrants from Dominica
Asian
Male Unemployment
Male Unemployment Comparison
Immigrants from Dominica
Asians
7.0%
MALE UNEMPLOYMENT
0.0/ 100
METRIC RATING
313th/ 347
METRIC RANK
5.1%
MALE UNEMPLOYMENT
93.7/ 100
METRIC RATING
96th/ 347
METRIC RANK
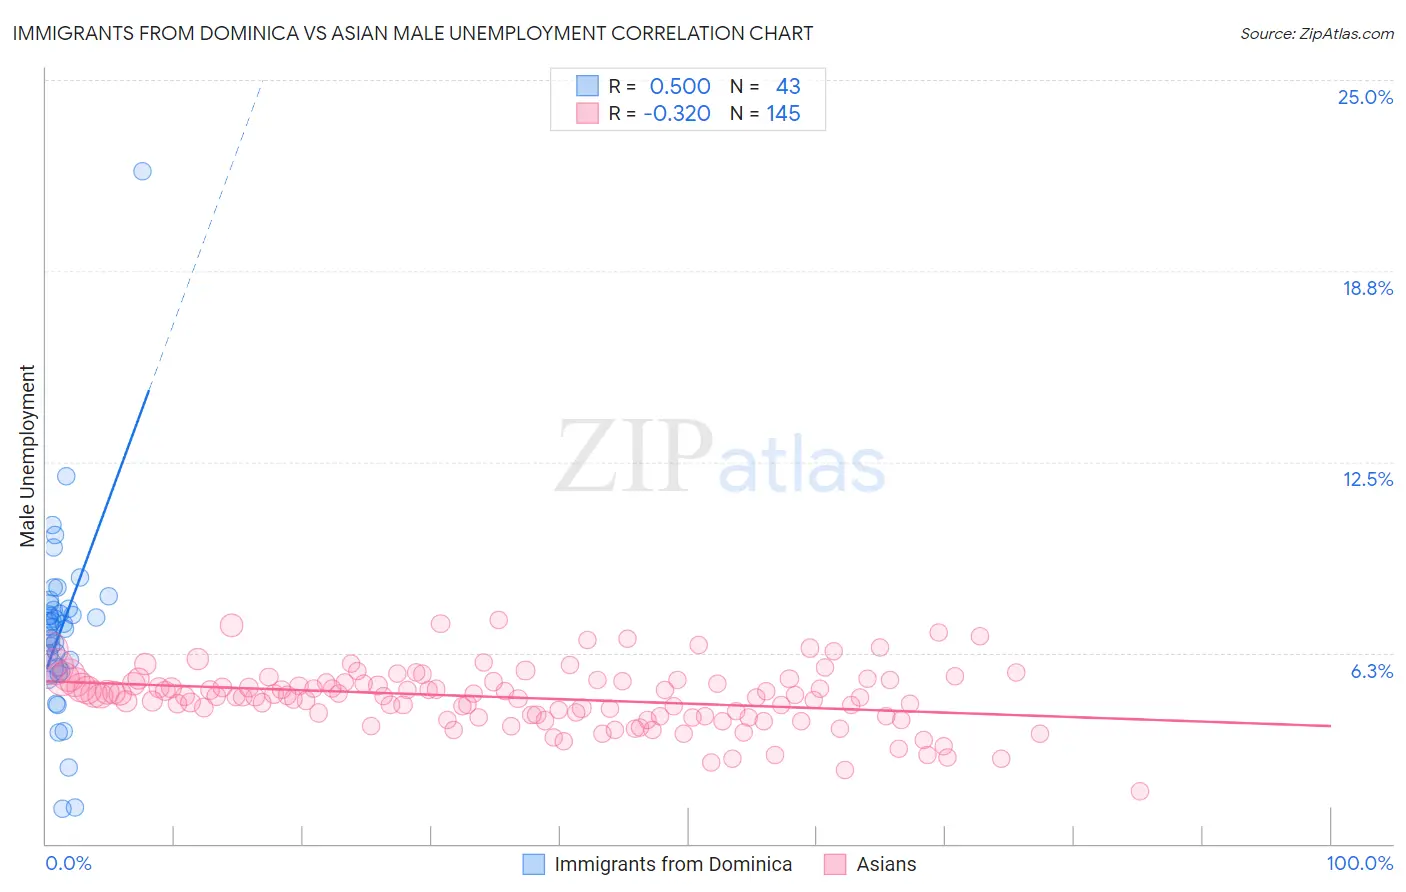
Immigrants from Dominica vs Asian Male Unemployment Correlation Chart
The statistical analysis conducted on geographies consisting of 83,742,223 people shows a moderate positive correlation between the proportion of Immigrants from Dominica and unemployment rate among males in the United States with a correlation coefficient (R) of 0.500 and weighted average of 7.0%. Similarly, the statistical analysis conducted on geographies consisting of 543,892,334 people shows a mild negative correlation between the proportion of Asians and unemployment rate among males in the United States with a correlation coefficient (R) of -0.320 and weighted average of 5.1%, a difference of 37.8%.
Male Unemployment Correlation Summary
| Measurement | Immigrants from Dominica | Asian |
| Minimum | 1.2% | 1.7% |
| Maximum | 22.0% | 7.3% |
| Range | 20.8% | 5.6% |
| Mean | 7.1% | 4.8% |
| Median | 7.2% | 4.8% |
| Interquartile 25% (IQ1) | 5.8% | 4.2% |
| Interquartile 75% (IQ3) | 7.9% | 5.3% |
| Interquartile Range (IQR) | 2.1% | 1.1% |
| Standard Deviation (Sample) | 3.2% | 0.98% |
| Standard Deviation (Population) | 3.1% | 0.98% |
Similar Demographics by Male Unemployment
Demographics Similar to Immigrants from Dominica by Male Unemployment
In terms of male unemployment, the demographic groups most similar to Immigrants from Dominica are Lumbee (6.9%, a difference of 1.0%), Immigrants from Armenia (6.9%, a difference of 1.2%), Immigrants from Barbados (7.1%, a difference of 1.3%), Houma (7.1%, a difference of 1.5%), and Immigrants from Guyana (7.1%, a difference of 1.5%).
| Demographics | Rating | Rank | Male Unemployment |
| Immigrants | Trinidad and Tobago | 0.0 /100 | #306 | Tragic 6.7% |
| Immigrants | Jamaica | 0.0 /100 | #307 | Tragic 6.7% |
| Aleuts | 0.0 /100 | #308 | Tragic 6.8% |
| Barbadians | 0.0 /100 | #309 | Tragic 6.9% |
| Blacks/African Americans | 0.0 /100 | #310 | Tragic 6.9% |
| Immigrants | Armenia | 0.0 /100 | #311 | Tragic 6.9% |
| Lumbee | 0.0 /100 | #312 | Tragic 6.9% |
| Immigrants | Dominica | 0.0 /100 | #313 | Tragic 7.0% |
| Immigrants | Barbados | 0.0 /100 | #314 | Tragic 7.1% |
| Houma | 0.0 /100 | #315 | Tragic 7.1% |
| Immigrants | Guyana | 0.0 /100 | #316 | Tragic 7.1% |
| Guyanese | 0.0 /100 | #317 | Tragic 7.1% |
| Cape Verdeans | 0.0 /100 | #318 | Tragic 7.1% |
| British West Indians | 0.0 /100 | #319 | Tragic 7.3% |
| Colville | 0.0 /100 | #320 | Tragic 7.4% |
Demographics Similar to Asians by Male Unemployment
In terms of male unemployment, the demographic groups most similar to Asians are Italian (5.1%, a difference of 0.030%), Immigrants from Spain (5.1%, a difference of 0.070%), Canadian (5.1%, a difference of 0.10%), Immigrants from Kuwait (5.1%, a difference of 0.11%), and Slavic (5.1%, a difference of 0.15%).
| Demographics | Rating | Rank | Male Unemployment |
| Immigrants | Australia | 94.7 /100 | #89 | Exceptional 5.1% |
| Okinawans | 94.7 /100 | #90 | Exceptional 5.1% |
| Immigrants | Turkey | 94.4 /100 | #91 | Exceptional 5.1% |
| Slavs | 94.2 /100 | #92 | Exceptional 5.1% |
| Immigrants | Serbia | 94.2 /100 | #93 | Exceptional 5.1% |
| Canadians | 94.1 /100 | #94 | Exceptional 5.1% |
| Italians | 93.8 /100 | #95 | Exceptional 5.1% |
| Asians | 93.7 /100 | #96 | Exceptional 5.1% |
| Immigrants | Spain | 93.4 /100 | #97 | Exceptional 5.1% |
| Immigrants | Kuwait | 93.3 /100 | #98 | Exceptional 5.1% |
| Uruguayans | 93.0 /100 | #99 | Exceptional 5.1% |
| Russians | 92.9 /100 | #100 | Exceptional 5.1% |
| German Russians | 92.7 /100 | #101 | Exceptional 5.1% |
| Immigrants | France | 92.7 /100 | #102 | Exceptional 5.1% |
| Immigrants | Jordan | 91.9 /100 | #103 | Exceptional 5.1% |