Immigrants from Czechoslovakia vs Swiss Bachelor's Degree
COMPARE
Immigrants from Czechoslovakia
Swiss
Bachelor's Degree
Bachelor's Degree Comparison
Immigrants from Czechoslovakia
Swiss
44.0%
BACHELOR'S DEGREE
99.9/ 100
METRIC RATING
58th/ 347
METRIC RANK
37.2%
BACHELOR'S DEGREE
34.1/ 100
METRIC RATING
190th/ 347
METRIC RANK
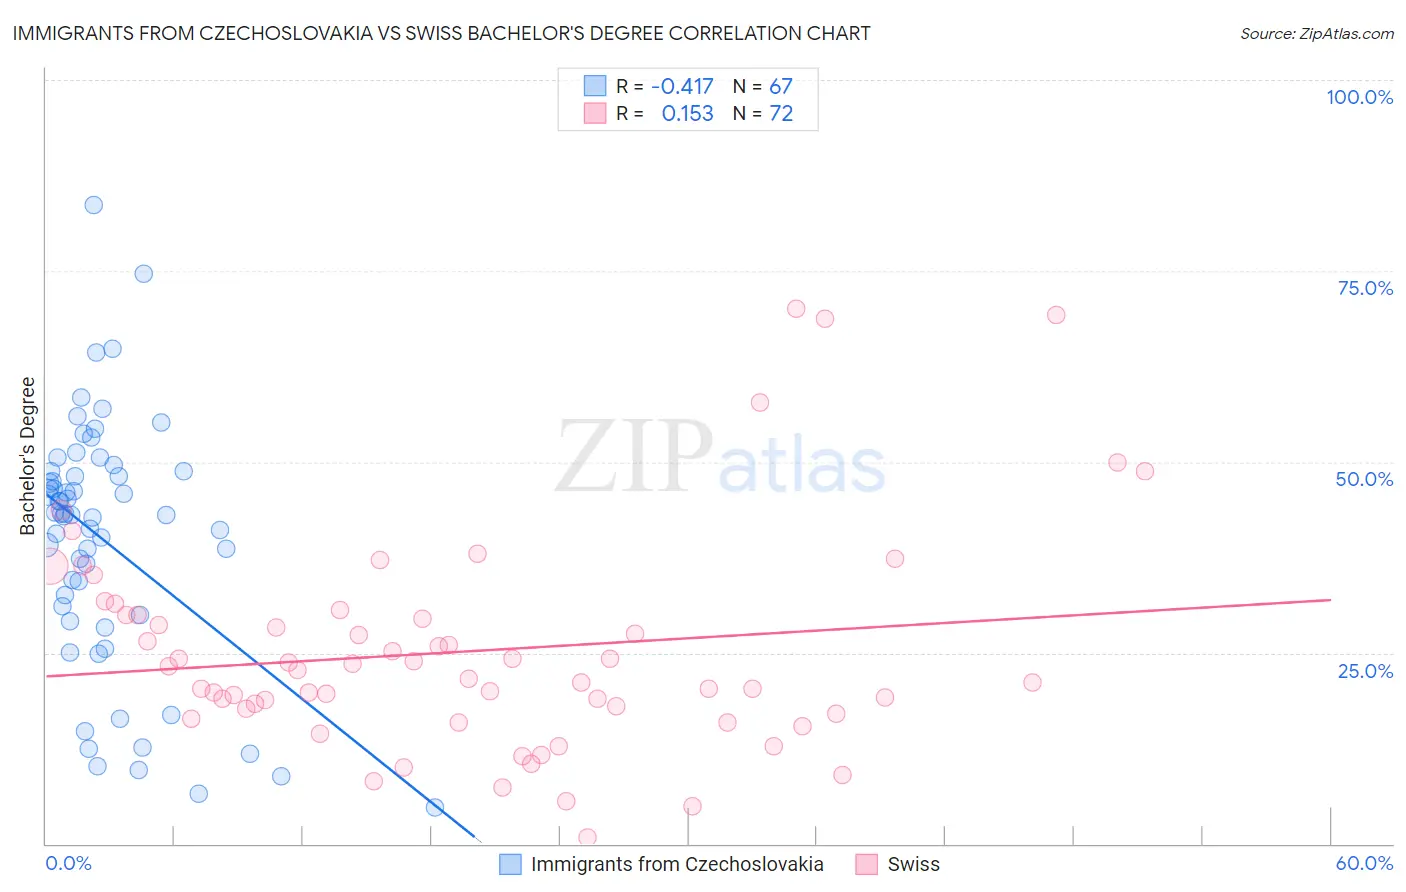
Immigrants from Czechoslovakia vs Swiss Bachelor's Degree Correlation Chart
The statistical analysis conducted on geographies consisting of 195,448,477 people shows a moderate negative correlation between the proportion of Immigrants from Czechoslovakia and percentage of population with at least bachelor's degree education in the United States with a correlation coefficient (R) of -0.417 and weighted average of 44.0%. Similarly, the statistical analysis conducted on geographies consisting of 464,980,651 people shows a poor positive correlation between the proportion of Swiss and percentage of population with at least bachelor's degree education in the United States with a correlation coefficient (R) of 0.153 and weighted average of 37.2%, a difference of 18.3%.
Bachelor's Degree Correlation Summary
| Measurement | Immigrants from Czechoslovakia | Swiss |
| Minimum | 4.8% | 0.82% |
| Maximum | 83.6% | 70.0% |
| Range | 78.9% | 69.2% |
| Mean | 39.6% | 25.2% |
| Median | 43.1% | 22.2% |
| Interquartile 25% (IQ1) | 29.9% | 17.3% |
| Interquartile 75% (IQ3) | 48.7% | 29.9% |
| Interquartile Range (IQR) | 18.8% | 12.6% |
| Standard Deviation (Sample) | 16.3% | 14.1% |
| Standard Deviation (Population) | 16.2% | 14.0% |
Similar Demographics by Bachelor's Degree
Demographics Similar to Immigrants from Czechoslovakia by Bachelor's Degree
In terms of bachelor's degree, the demographic groups most similar to Immigrants from Czechoslovakia are Paraguayan (44.0%, a difference of 0.050%), Australian (44.0%, a difference of 0.10%), New Zealander (44.0%, a difference of 0.11%), Immigrants from Serbia (44.1%, a difference of 0.24%), and Immigrants from Bolivia (44.2%, a difference of 0.42%).
| Demographics | Rating | Rank | Bachelor's Degree |
| Asians | 99.9 /100 | #51 | Exceptional 44.4% |
| Immigrants | Spain | 99.9 /100 | #52 | Exceptional 44.3% |
| Immigrants | Asia | 99.9 /100 | #53 | Exceptional 44.3% |
| Immigrants | Austria | 99.9 /100 | #54 | Exceptional 44.2% |
| Immigrants | Bolivia | 99.9 /100 | #55 | Exceptional 44.2% |
| Immigrants | Serbia | 99.9 /100 | #56 | Exceptional 44.1% |
| Paraguayans | 99.9 /100 | #57 | Exceptional 44.0% |
| Immigrants | Czechoslovakia | 99.9 /100 | #58 | Exceptional 44.0% |
| Australians | 99.9 /100 | #59 | Exceptional 44.0% |
| New Zealanders | 99.9 /100 | #60 | Exceptional 44.0% |
| South Africans | 99.8 /100 | #61 | Exceptional 43.6% |
| Immigrants | Kazakhstan | 99.8 /100 | #62 | Exceptional 43.4% |
| Immigrants | Europe | 99.8 /100 | #63 | Exceptional 43.4% |
| Argentineans | 99.7 /100 | #64 | Exceptional 43.3% |
| Zimbabweans | 99.7 /100 | #65 | Exceptional 43.3% |
Demographics Similar to Swiss by Bachelor's Degree
In terms of bachelor's degree, the demographic groups most similar to Swiss are Nigerian (37.2%, a difference of 0.020%), Immigrants from Vietnam (37.1%, a difference of 0.22%), Yugoslavian (37.1%, a difference of 0.29%), Slovak (37.3%, a difference of 0.30%), and Immigrants from Oceania (37.3%, a difference of 0.35%).
| Demographics | Rating | Rank | Bachelor's Degree |
| Senegalese | 42.2 /100 | #183 | Average 37.5% |
| Scandinavians | 41.7 /100 | #184 | Average 37.5% |
| Immigrants | Peru | 41.3 /100 | #185 | Average 37.5% |
| Norwegians | 40.4 /100 | #186 | Average 37.5% |
| English | 39.7 /100 | #187 | Fair 37.4% |
| Immigrants | Oceania | 37.3 /100 | #188 | Fair 37.3% |
| Slovaks | 36.9 /100 | #189 | Fair 37.3% |
| Swiss | 34.1 /100 | #190 | Fair 37.2% |
| Nigerians | 33.9 /100 | #191 | Fair 37.2% |
| Immigrants | Vietnam | 32.1 /100 | #192 | Fair 37.1% |
| Yugoslavians | 31.5 /100 | #193 | Fair 37.1% |
| Belgians | 29.9 /100 | #194 | Fair 37.0% |
| Koreans | 29.8 /100 | #195 | Fair 37.0% |
| Celtics | 29.5 /100 | #196 | Fair 37.0% |
| Czechoslovakians | 29.2 /100 | #197 | Fair 37.0% |