Immigrants from Cuba vs Paiute College, 1 year or more
COMPARE
Immigrants from Cuba
Paiute
College, 1 year or more
College, 1 year or more Comparison
Immigrants from Cuba
Paiute
50.7%
COLLEGE, 1 YEAR OR MORE
0.0/ 100
METRIC RATING
324th/ 347
METRIC RANK
52.9%
COLLEGE, 1 YEAR OR MORE
0.0/ 100
METRIC RATING
297th/ 347
METRIC RANK
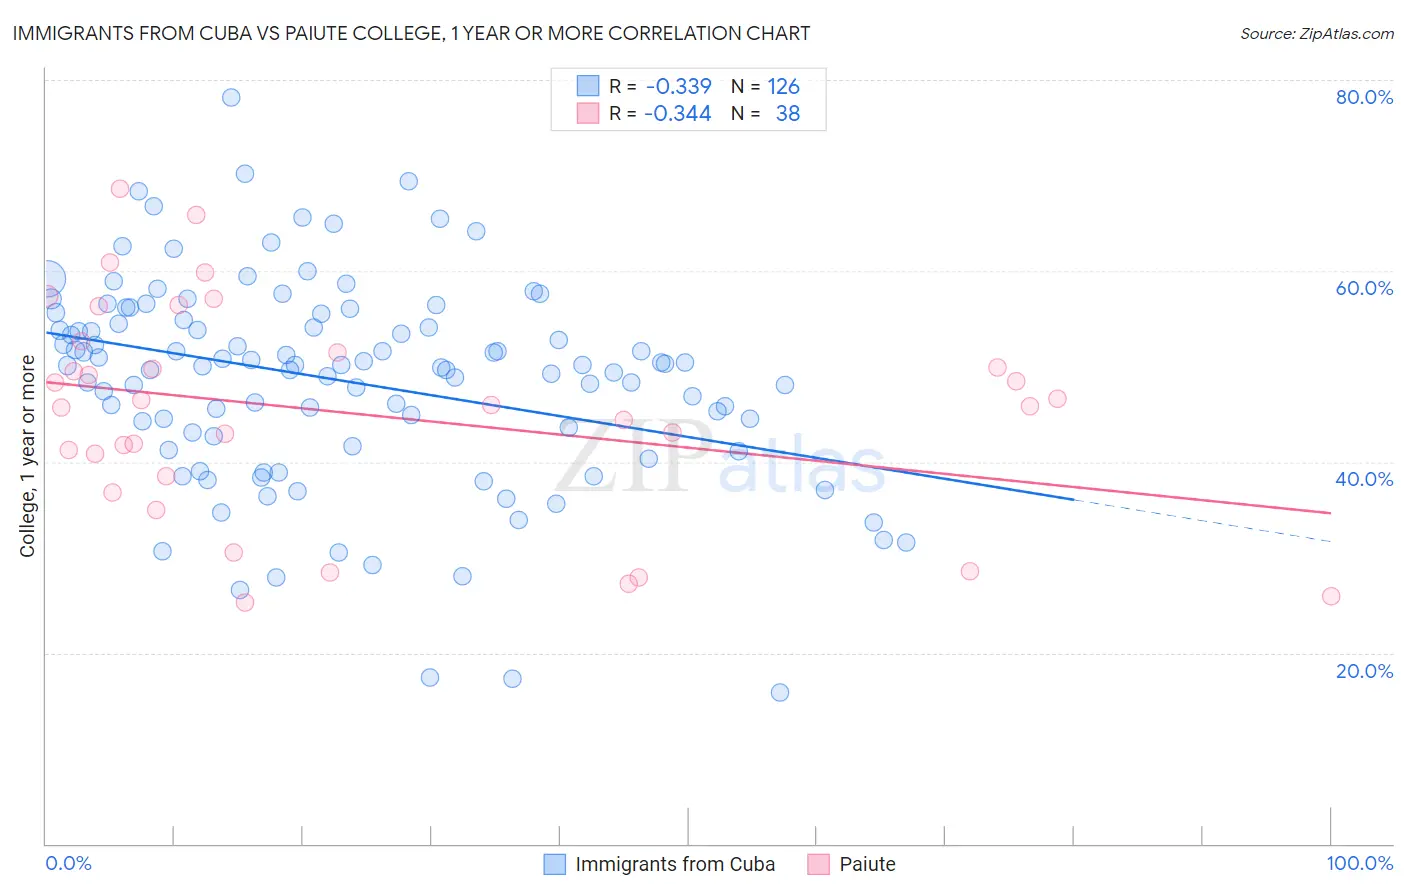
Immigrants from Cuba vs Paiute College, 1 year or more Correlation Chart
The statistical analysis conducted on geographies consisting of 326,030,445 people shows a mild negative correlation between the proportion of Immigrants from Cuba and percentage of population with at least college, 1 year or more education in the United States with a correlation coefficient (R) of -0.339 and weighted average of 50.7%. Similarly, the statistical analysis conducted on geographies consisting of 58,404,248 people shows a mild negative correlation between the proportion of Paiute and percentage of population with at least college, 1 year or more education in the United States with a correlation coefficient (R) of -0.344 and weighted average of 52.9%, a difference of 4.3%.
College, 1 year or more Correlation Summary
| Measurement | Immigrants from Cuba | Paiute |
| Minimum | 15.9% | 25.3% |
| Maximum | 78.2% | 68.6% |
| Range | 62.3% | 43.4% |
| Mean | 48.5% | 45.0% |
| Median | 50.1% | 45.9% |
| Interquartile 25% (IQ1) | 42.7% | 38.5% |
| Interquartile 75% (IQ3) | 54.8% | 51.5% |
| Interquartile Range (IQR) | 12.2% | 13.0% |
| Standard Deviation (Sample) | 10.9% | 11.2% |
| Standard Deviation (Population) | 10.8% | 11.0% |
Similar Demographics by College, 1 year or more
Demographics Similar to Immigrants from Cuba by College, 1 year or more
In terms of college, 1 year or more, the demographic groups most similar to Immigrants from Cuba are Immigrants from Guatemala (50.7%, a difference of 0.010%), Immigrants from Latin America (50.7%, a difference of 0.030%), Dominican (50.6%, a difference of 0.21%), Navajo (50.8%, a difference of 0.24%), and Menominee (50.6%, a difference of 0.25%).
| Demographics | Rating | Rank | College, 1 year or more |
| Hispanics or Latinos | 0.0 /100 | #317 | Tragic 51.1% |
| Immigrants | Honduras | 0.0 /100 | #318 | Tragic 51.0% |
| Immigrants | El Salvador | 0.0 /100 | #319 | Tragic 51.0% |
| Kiowa | 0.0 /100 | #320 | Tragic 51.0% |
| Hopi | 0.0 /100 | #321 | Tragic 50.9% |
| Navajo | 0.0 /100 | #322 | Tragic 50.8% |
| Immigrants | Guatemala | 0.0 /100 | #323 | Tragic 50.7% |
| Immigrants | Cuba | 0.0 /100 | #324 | Tragic 50.7% |
| Immigrants | Latin America | 0.0 /100 | #325 | Tragic 50.7% |
| Dominicans | 0.0 /100 | #326 | Tragic 50.6% |
| Menominee | 0.0 /100 | #327 | Tragic 50.6% |
| Dutch West Indians | 0.0 /100 | #328 | Tragic 50.5% |
| Cape Verdeans | 0.0 /100 | #329 | Tragic 50.3% |
| Natives/Alaskans | 0.0 /100 | #330 | Tragic 50.2% |
| Immigrants | Yemen | 0.0 /100 | #331 | Tragic 50.0% |
Demographics Similar to Paiute by College, 1 year or more
In terms of college, 1 year or more, the demographic groups most similar to Paiute are Sioux (53.0%, a difference of 0.28%), Immigrants from Dominica (52.5%, a difference of 0.59%), Yaqui (53.2%, a difference of 0.62%), Cherokee (53.2%, a difference of 0.63%), and Black/African American (53.3%, a difference of 0.84%).
| Demographics | Rating | Rank | College, 1 year or more |
| Alaskan Athabascans | 0.0 /100 | #290 | Tragic 53.4% |
| Cubans | 0.0 /100 | #291 | Tragic 53.4% |
| Chickasaw | 0.0 /100 | #292 | Tragic 53.3% |
| Blacks/African Americans | 0.0 /100 | #293 | Tragic 53.3% |
| Cherokee | 0.0 /100 | #294 | Tragic 53.2% |
| Yaqui | 0.0 /100 | #295 | Tragic 53.2% |
| Sioux | 0.0 /100 | #296 | Tragic 53.0% |
| Paiute | 0.0 /100 | #297 | Tragic 52.9% |
| Immigrants | Dominica | 0.0 /100 | #298 | Tragic 52.5% |
| Immigrants | Nicaragua | 0.0 /100 | #299 | Tragic 52.4% |
| Choctaw | 0.0 /100 | #300 | Tragic 52.3% |
| Haitians | 0.0 /100 | #301 | Tragic 52.3% |
| Puerto Ricans | 0.0 /100 | #302 | Tragic 52.2% |
| Creek | 0.0 /100 | #303 | Tragic 52.2% |
| Central Americans | 0.0 /100 | #304 | Tragic 52.1% |