Immigrants from Cuba vs Creek College, 1 year or more
COMPARE
Immigrants from Cuba
Creek
College, 1 year or more
College, 1 year or more Comparison
Immigrants from Cuba
Creek
50.7%
COLLEGE, 1 YEAR OR MORE
0.0/ 100
METRIC RATING
324th/ 347
METRIC RANK
52.2%
COLLEGE, 1 YEAR OR MORE
0.0/ 100
METRIC RATING
303rd/ 347
METRIC RANK
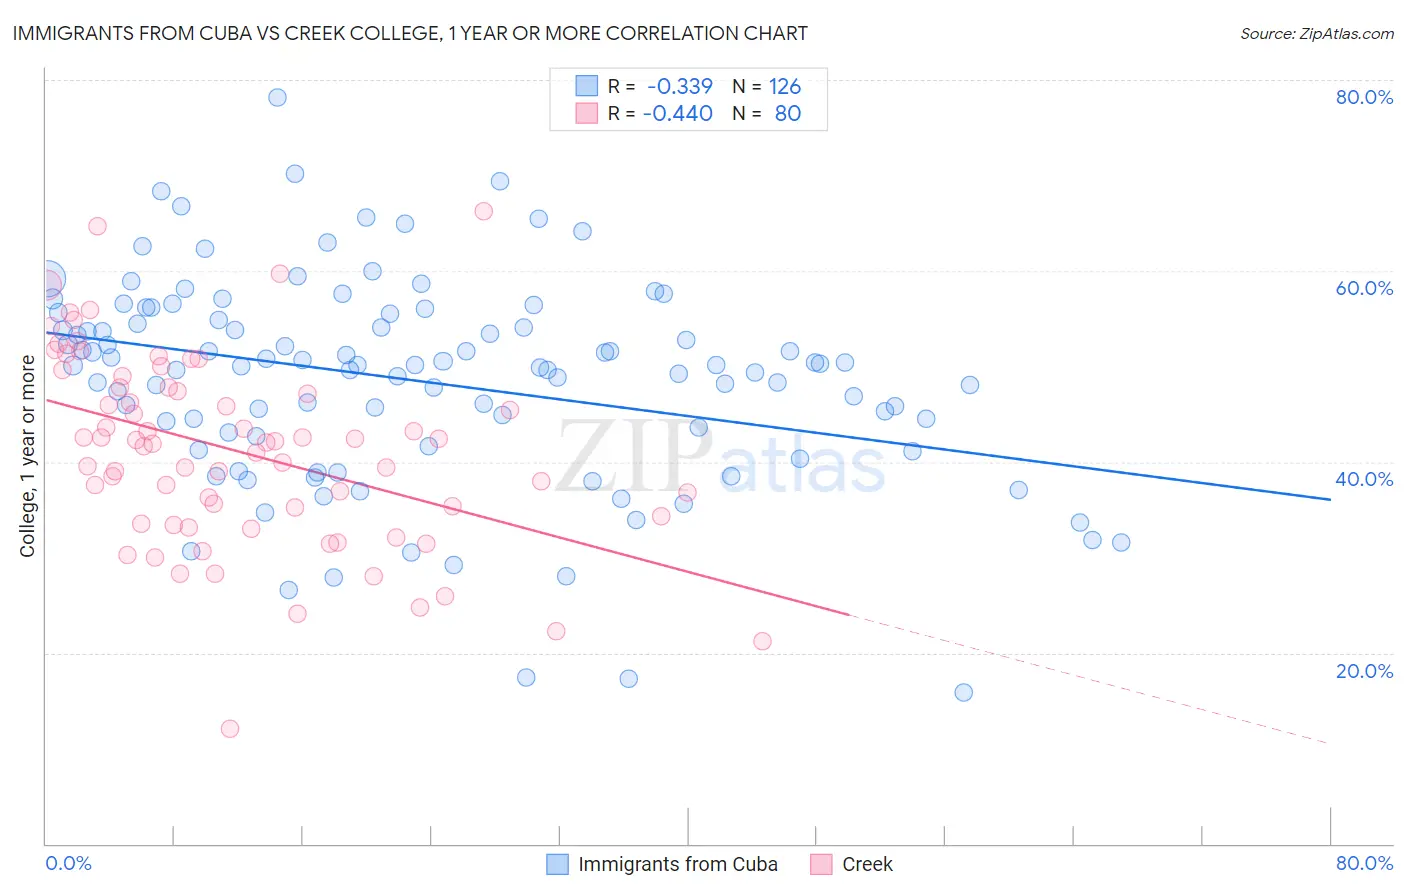
Immigrants from Cuba vs Creek College, 1 year or more Correlation Chart
The statistical analysis conducted on geographies consisting of 326,030,445 people shows a mild negative correlation between the proportion of Immigrants from Cuba and percentage of population with at least college, 1 year or more education in the United States with a correlation coefficient (R) of -0.339 and weighted average of 50.7%. Similarly, the statistical analysis conducted on geographies consisting of 178,480,714 people shows a moderate negative correlation between the proportion of Creek and percentage of population with at least college, 1 year or more education in the United States with a correlation coefficient (R) of -0.440 and weighted average of 52.2%, a difference of 3.0%.
College, 1 year or more Correlation Summary
| Measurement | Immigrants from Cuba | Creek |
| Minimum | 15.9% | 12.0% |
| Maximum | 78.2% | 66.3% |
| Range | 62.3% | 54.2% |
| Mean | 48.5% | 41.1% |
| Median | 50.1% | 42.0% |
| Interquartile 25% (IQ1) | 42.7% | 33.9% |
| Interquartile 75% (IQ3) | 54.8% | 47.8% |
| Interquartile Range (IQR) | 12.2% | 13.9% |
| Standard Deviation (Sample) | 10.9% | 10.1% |
| Standard Deviation (Population) | 10.8% | 10.1% |
Similar Demographics by College, 1 year or more
Demographics Similar to Immigrants from Cuba by College, 1 year or more
In terms of college, 1 year or more, the demographic groups most similar to Immigrants from Cuba are Immigrants from Guatemala (50.7%, a difference of 0.010%), Immigrants from Latin America (50.7%, a difference of 0.030%), Dominican (50.6%, a difference of 0.21%), Navajo (50.8%, a difference of 0.24%), and Menominee (50.6%, a difference of 0.25%).
| Demographics | Rating | Rank | College, 1 year or more |
| Hispanics or Latinos | 0.0 /100 | #317 | Tragic 51.1% |
| Immigrants | Honduras | 0.0 /100 | #318 | Tragic 51.0% |
| Immigrants | El Salvador | 0.0 /100 | #319 | Tragic 51.0% |
| Kiowa | 0.0 /100 | #320 | Tragic 51.0% |
| Hopi | 0.0 /100 | #321 | Tragic 50.9% |
| Navajo | 0.0 /100 | #322 | Tragic 50.8% |
| Immigrants | Guatemala | 0.0 /100 | #323 | Tragic 50.7% |
| Immigrants | Cuba | 0.0 /100 | #324 | Tragic 50.7% |
| Immigrants | Latin America | 0.0 /100 | #325 | Tragic 50.7% |
| Dominicans | 0.0 /100 | #326 | Tragic 50.6% |
| Menominee | 0.0 /100 | #327 | Tragic 50.6% |
| Dutch West Indians | 0.0 /100 | #328 | Tragic 50.5% |
| Cape Verdeans | 0.0 /100 | #329 | Tragic 50.3% |
| Natives/Alaskans | 0.0 /100 | #330 | Tragic 50.2% |
| Immigrants | Yemen | 0.0 /100 | #331 | Tragic 50.0% |
Demographics Similar to Creek by College, 1 year or more
In terms of college, 1 year or more, the demographic groups most similar to Creek are Puerto Rican (52.2%, a difference of 0.080%), Central American (52.1%, a difference of 0.14%), Haitian (52.3%, a difference of 0.21%), Seminole (52.1%, a difference of 0.23%), and Choctaw (52.3%, a difference of 0.26%).
| Demographics | Rating | Rank | College, 1 year or more |
| Sioux | 0.0 /100 | #296 | Tragic 53.0% |
| Paiute | 0.0 /100 | #297 | Tragic 52.9% |
| Immigrants | Dominica | 0.0 /100 | #298 | Tragic 52.5% |
| Immigrants | Nicaragua | 0.0 /100 | #299 | Tragic 52.4% |
| Choctaw | 0.0 /100 | #300 | Tragic 52.3% |
| Haitians | 0.0 /100 | #301 | Tragic 52.3% |
| Puerto Ricans | 0.0 /100 | #302 | Tragic 52.2% |
| Creek | 0.0 /100 | #303 | Tragic 52.2% |
| Central Americans | 0.0 /100 | #304 | Tragic 52.1% |
| Seminole | 0.0 /100 | #305 | Tragic 52.1% |
| Mexican American Indians | 0.0 /100 | #306 | Tragic 51.9% |
| Immigrants | Portugal | 0.0 /100 | #307 | Tragic 51.9% |
| Salvadorans | 0.0 /100 | #308 | Tragic 51.8% |
| Apache | 0.0 /100 | #309 | Tragic 51.8% |
| Hondurans | 0.0 /100 | #310 | Tragic 51.6% |