Immigrants from Cuba vs Immigrants from Indonesia College, 1 year or more

COMPARE

Immigrants from Cuba
Race
Ancestry
AfghanAfricanAlaska NativeAlaskan AthabascanAlbanianAleutAlsatianAmericanApacheArabArapahoArgentineanArmenianAssyrian/Chaldean/SyriacAustralianAustrianBahamianBangladeshiBarbadianBasqueBelgianBelizeanBermudanBhutaneseBlackfeetBolivianBrazilianBritishBritish West IndianBulgarianBurmeseCajunCambodianCanadianCape VerdeanCarpatho RusynCelticCentral AmericanCentral American IndianCherokeeCheyenneChickasawChileanChineseChippewaChoctawColombianColvilleComancheCosta RicanCreeCreekCroatianCrowCubanCypriotCzechCzechoslovakianDanishDelawareDominicanDutchDutch West IndianEastern EuropeanEcuadorianEgyptianEnglishEstonianEthiopianEuropeanFijianFilipinoFinnishFrenchFrench American IndianFrench CanadianGermanGerman RussianGhanaianGreekGuamanian/ChamorroGuatemalanGuyaneseHaitianHmongHonduranHopiHoumaHungarianIcelanderIndian (Asian)IndonesianInupiatIranianIraqiIrishIroquoisIsraeliItalianJamaicanJapaneseJordanianKenyanKiowaKoreanLaotianLatvianLebaneseLiberianLithuanianLumbeeLuxembourgerMacedonianMalaysianMalteseMarshalleseMenomineeMexicanMexican American IndianMongolianMoroccanNative HawaiianNavajoNepaleseNew ZealanderNicaraguanNigerianNorthern EuropeanNorwegianOkinawanOsageOttawaPaiutePakistaniPalestinianPanamanianParaguayanPennsylvania GermanPeruvianPimaPolishPortuguesePotawatomiPuebloPuerto RicanPuget Sound SalishRomanianRussianSalvadoranSamoanScandinavianScotch-IrishScottishSeminoleSenegaleseSerbianShoshoneSierra LeoneanSiouxSlavicSlovakSloveneSomaliSouth AfricanSouth AmericanSouth American IndianSoviet UnionSpaniardSpanishSpanish AmericanSpanish American IndianSri LankanSubsaharan AfricanSudaneseSwedishSwissSyrianTaiwaneseThaiTlingit-HaidaTohono O'OdhamTonganTrinidadian and TobagonianTsimshianTurkishU.S. Virgin IslanderUgandanUkrainianUruguayanUteVenezuelanVietnameseWelshWest IndianYakamaYaquiYugoslavianYumanYup'ikZimbabwean
Immigration
NonimmigrantsImmigrantsAfghanistanAfricaAlbaniaArgentinaArmeniaAsiaAustraliaAustriaBahamasBangladeshBarbadosBelarusBelgiumBelizeBoliviaBosnia and HerzegovinaBrazilBulgariaBurma/MyanmarCabo VerdeCambodiaCameroonCanadaCaribbeanCentral AmericaChileChinaColombiaCongoCosta RicaCroatiaCubaCzechoslovakiaDenmarkDominicaDominican RepublicEastern AfricaEastern AsiaEastern EuropeEcuadorEgyptEl SalvadorEnglandEritreaEthiopiaEuropeFijiFranceGermanyGhanaGreeceGrenadaGuatemalaGuyanaHaitiHondurasHong KongHungaryIndiaIranIraqIrelandIsraelItalyJamaicaJapanJordanKazakhstanKenyaKoreaKuwaitLaosLatin AmericaLatviaLebanonLiberiaLithuaniaMalaysiaMexicoMicronesiaMiddle AfricaMoldovaMoroccoNepalNetherlandsNicaraguaNigeriaNorth AmericaNorth MacedoniaNorthern AfricaNorthern EuropeNorwayOceaniaPakistanPanamaPeruPhilippinesPolandPortugalRomaniaRussiaSaudi ArabiaScotlandSenegalSerbiaSierra LeoneSingaporeSomaliaSouth AfricaSouth AmericaSouth Central AsiaSouth Eastern AsiaSouthern EuropeSpainSri LankaSt. Vincent and the GrenadinesSudanSwedenSwitzerlandSyriaTaiwanThailandTrinidad and TobagoTurkeyUgandaUkraineUruguayUzbekistanVenezuelaVietnamWest IndiesWestern AfricaWestern AsiaWestern EuropeYemenZaireZimbabweAzores
Immigrants from Indonesia
Race
Ancestry
AfghanAfricanAlaska NativeAlaskan AthabascanAlbanianAleutAlsatianAmericanApacheArabArapahoArgentineanArmenianAssyrian/Chaldean/SyriacAustralianAustrianBahamianBangladeshiBarbadianBasqueBelgianBelizeanBermudanBhutaneseBlackfeetBolivianBrazilianBritishBritish West IndianBulgarianBurmeseCajunCambodianCanadianCape VerdeanCarpatho RusynCelticCentral AmericanCentral American IndianCherokeeCheyenneChickasawChileanChineseChippewaChoctawColombianColvilleComancheCosta RicanCreeCreekCroatianCrowCubanCypriotCzechCzechoslovakianDanishDelawareDominicanDutchDutch West IndianEastern EuropeanEcuadorianEgyptianEnglishEstonianEthiopianEuropeanFijianFilipinoFinnishFrenchFrench American IndianFrench CanadianGermanGerman RussianGhanaianGreekGuamanian/ChamorroGuatemalanGuyaneseHaitianHmongHonduranHopiHoumaHungarianIcelanderIndian (Asian)IndonesianInupiatIranianIraqiIrishIroquoisIsraeliItalianJamaicanJapaneseJordanianKenyanKiowaKoreanLaotianLatvianLebaneseLiberianLithuanianLumbeeLuxembourgerMacedonianMalaysianMalteseMarshalleseMenomineeMexicanMexican American IndianMongolianMoroccanNative HawaiianNavajoNepaleseNew ZealanderNicaraguanNigerianNorthern EuropeanNorwegianOkinawanOsageOttawaPaiutePakistaniPalestinianPanamanianParaguayanPennsylvania GermanPeruvianPimaPolishPortuguesePotawatomiPuebloPuerto RicanPuget Sound SalishRomanianRussianSalvadoranSamoanScandinavianScotch-IrishScottishSeminoleSenegaleseSerbianShoshoneSierra LeoneanSiouxSlavicSlovakSloveneSomaliSouth AfricanSouth AmericanSouth American IndianSoviet UnionSpaniardSpanishSpanish AmericanSpanish American IndianSri LankanSubsaharan AfricanSudaneseSwedishSwissSyrianTaiwaneseThaiTlingit-HaidaTohono O'OdhamTonganTrinidadian and TobagonianTsimshianTurkishU.S. Virgin IslanderUgandanUkrainianUruguayanUteVenezuelanVietnameseWelshWest IndianYakamaYaquiYugoslavianYumanYup'ikZimbabwean
Immigration
NonimmigrantsImmigrantsAfghanistanAfricaAlbaniaArgentinaArmeniaAsiaAustraliaAustriaBahamasBangladeshBarbadosBelarusBelgiumBelizeBoliviaBosnia and HerzegovinaBrazilBulgariaBurma/MyanmarCabo VerdeCambodiaCameroonCanadaCaribbeanCentral AmericaChileChinaColombiaCongoCosta RicaCroatiaCzechoslovakiaDenmarkDominicaDominican RepublicEastern AfricaEastern AsiaEastern EuropeEcuadorEgyptEl SalvadorEnglandEritreaEthiopiaEuropeFijiFranceGermanyGhanaGreeceGrenadaGuatemalaGuyanaHaitiHondurasHong KongHungaryIndiaIndonesiaIranIraqIrelandIsraelItalyJamaicaJapanJordanKazakhstanKenyaKoreaKuwaitLaosLatin AmericaLatviaLebanonLiberiaLithuaniaMalaysiaMexicoMicronesiaMiddle AfricaMoldovaMoroccoNepalNetherlandsNicaraguaNigeriaNorth AmericaNorth MacedoniaNorthern AfricaNorthern EuropeNorwayOceaniaPakistanPanamaPeruPhilippinesPolandPortugalRomaniaRussiaSaudi ArabiaScotlandSenegalSerbiaSierra LeoneSingaporeSomaliaSouth AfricaSouth AmericaSouth Central AsiaSouth Eastern AsiaSouthern EuropeSpainSri LankaSt. Vincent and the GrenadinesSudanSwedenSwitzerlandSyriaTaiwanThailandTrinidad and TobagoTurkeyUgandaUkraineUruguayUzbekistanVenezuelaVietnamWest IndiesWestern AfricaWestern AsiaWestern EuropeYemenZaireZimbabweAzores
College, 1 year or more
Income
Poverty
Unemployment
Labor Participation
Family Structure
Vehicle Availability
Education Level
Disability

College, 1 year or more Comparison

Immigrants from Cuba

Immigrants from Indonesia

Tragic
Exceptional
50.7%
COLLEGE, 1 YEAR OR MORE
0.0/ 100
METRIC RATING
324th/ 347
METRIC RANK
63.5%
COLLEGE, 1 YEAR OR MORE
99.5/ 100
METRIC RATING
62nd/ 347
METRIC RANK

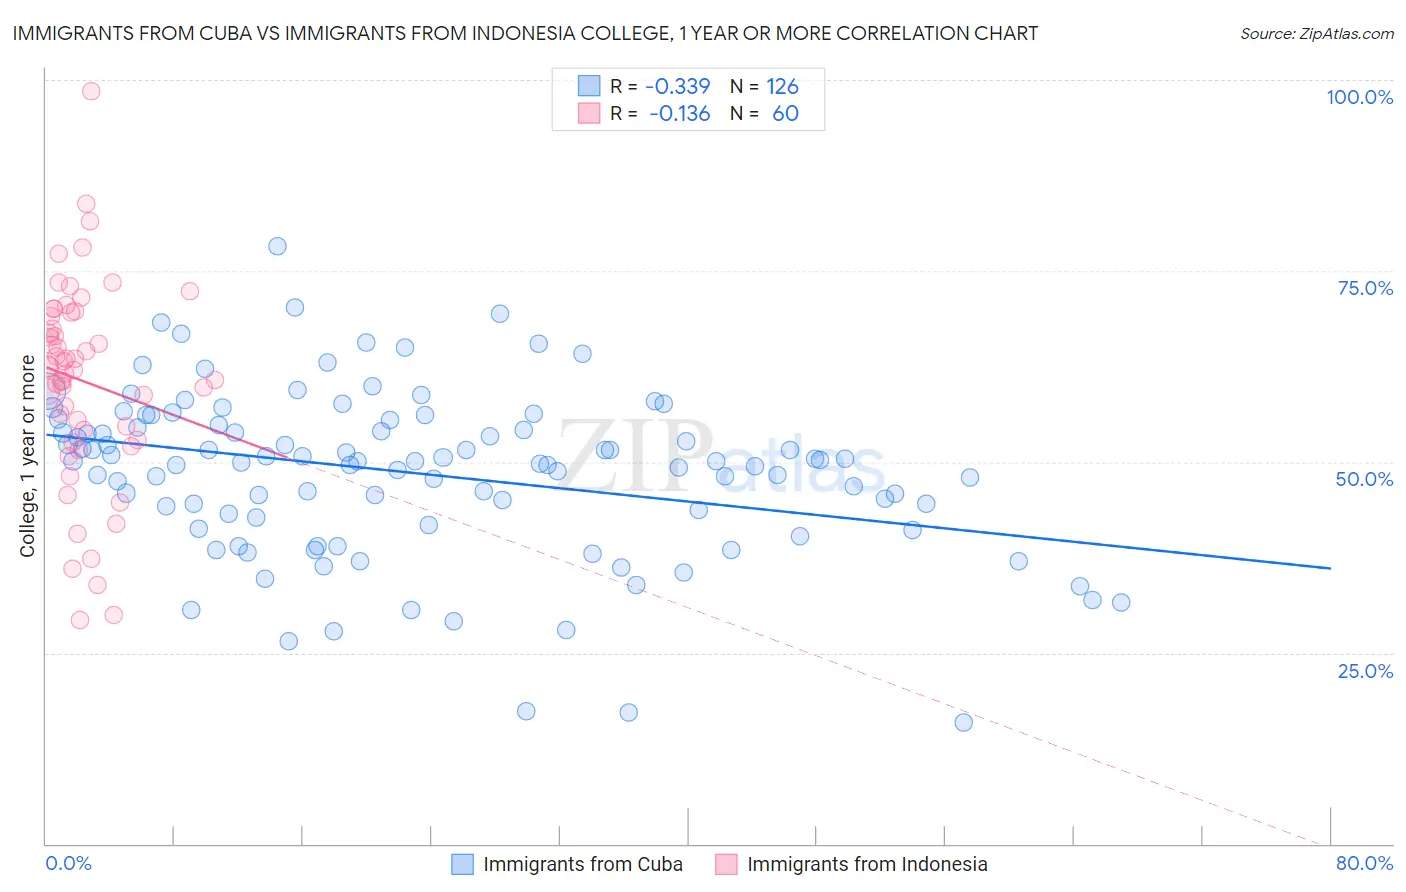
Immigrants from Cuba vs Immigrants from Indonesia College, 1 year or more Correlation Chart

The statistical analysis conducted on geographies consisting of 326,030,445 people shows a mild negative correlation between the proportion of Immigrants from Cuba and percentage of population with at least college, 1 year or more education in the United States with a correlation coefficient (R) of -0.339 and weighted average of 50.7%. Similarly, the statistical analysis conducted on geographies consisting of 215,783,142 people shows a poor negative correlation between the proportion of Immigrants from Indonesia and percentage of population with at least college, 1 year or more education in the United States with a correlation coefficient (R) of -0.136 and weighted average of 63.5%, a difference of 25.3%.
Immigrants from Cuba vs Immigrants from Indonesia College, 1 year or more

College, 1 year or more Correlation Summary

MeasurementImmigrants from CubaImmigrants from Indonesia
Minimum15.9%29.3%
Maximum78.2%98.6%
Range62.3%69.3%
Mean48.5%60.6%
Median50.1%62.2%
Interquartile 25% (IQ1)42.7%53.6%
Interquartile 75% (IQ3)54.8%69.3%
Interquartile Range (IQR)12.2%15.7%
Standard Deviation (Sample)10.9%13.2%
Standard Deviation (Population)10.8%13.1%

Similar Demographics by College, 1 year or more

Demographics Similar to Immigrants from Cuba by College, 1 year or more

In terms of college, 1 year or more, the demographic groups most similar to Immigrants from Cuba are Immigrants from Guatemala (50.7%, a difference of 0.010%), Immigrants from Latin America (50.7%, a difference of 0.030%), Dominican (50.6%, a difference of 0.21%), Navajo (50.8%, a difference of 0.24%), and Menominee (50.6%, a difference of 0.25%).
DemographicsRating | RankCollege, 1 year or more
Hispanics or Latinos
0.0
/100
|
#317
Tragic
51.1%
Immigrants | Honduras
0.0
/100
|
#318
Tragic
51.0%
Immigrants | El Salvador
0.0
/100
|
#319
Tragic
51.0%
Kiowa
0.0
/100
|
#320
Tragic
51.0%
Hopi
0.0
/100
|
#321
Tragic
50.9%
Navajo
0.0
/100
|
#322
Tragic
50.8%
Immigrants | Guatemala
0.0
/100
|
#323
Tragic
50.7%
Immigrants | Cuba
0.0
/100
|
#324
Tragic
50.7%
Immigrants | Latin America
0.0
/100
|
#325
Tragic
50.7%
Dominicans
0.0
/100
|
#326
Tragic
50.6%
Menominee
0.0
/100
|
#327
Tragic
50.6%
Dutch West Indians
0.0
/100
|
#328
Tragic
50.5%
Cape Verdeans
0.0
/100
|
#329
Tragic
50.3%
Natives/Alaskans
0.0
/100
|
#330
Tragic
50.2%
Immigrants | Yemen
0.0
/100
|
#331
Tragic
50.0%

Demographics Similar to Immigrants from Indonesia by College, 1 year or more

In terms of college, 1 year or more, the demographic groups most similar to Immigrants from Indonesia are Bolivian (63.5%, a difference of 0.010%), Immigrants from Kazakhstan (63.6%, a difference of 0.12%), Immigrants from Scotland (63.4%, a difference of 0.13%), Immigrants from Spain (63.4%, a difference of 0.16%), and Maltese (63.4%, a difference of 0.27%).
DemographicsRating | RankCollege, 1 year or more
Immigrants | Belarus
99.7
/100
|
#55
Exceptional
64.1%
Immigrants | Czechoslovakia
99.7
/100
|
#56
Exceptional
64.1%
South Africans
99.7
/100
|
#57
Exceptional
64.1%
Immigrants | Asia
99.7
/100
|
#58
Exceptional
64.0%
Immigrants | Serbia
99.6
/100
|
#59
Exceptional
63.8%
Immigrants | Kazakhstan
99.5
/100
|
#60
Exceptional
63.6%
Bolivians
99.5
/100
|
#61
Exceptional
63.5%
Immigrants | Indonesia
99.5
/100
|
#62
Exceptional
63.5%
Immigrants | Scotland
99.4
/100
|
#63
Exceptional
63.4%
Immigrants | Spain
99.4
/100
|
#64
Exceptional
63.4%
Maltese
99.3
/100
|
#65
Exceptional
63.4%
Immigrants | Europe
99.3
/100
|
#66
Exceptional
63.3%
Immigrants | Romania
99.3
/100
|
#67
Exceptional
63.3%
Immigrants | Greece
99.3
/100
|
#68
Exceptional
63.3%
Immigrants | Zimbabwe
99.3
/100
|
#69
Exceptional
63.3%