Immigrants from Cuba vs Hungarian College, 1 year or more
COMPARE
Immigrants from Cuba
Hungarian
College, 1 year or more
College, 1 year or more Comparison
Immigrants from Cuba
Hungarians
50.7%
COLLEGE, 1 YEAR OR MORE
0.0/ 100
METRIC RATING
324th/ 347
METRIC RANK
59.5%
COLLEGE, 1 YEAR OR MORE
52.9/ 100
METRIC RATING
168th/ 347
METRIC RANK
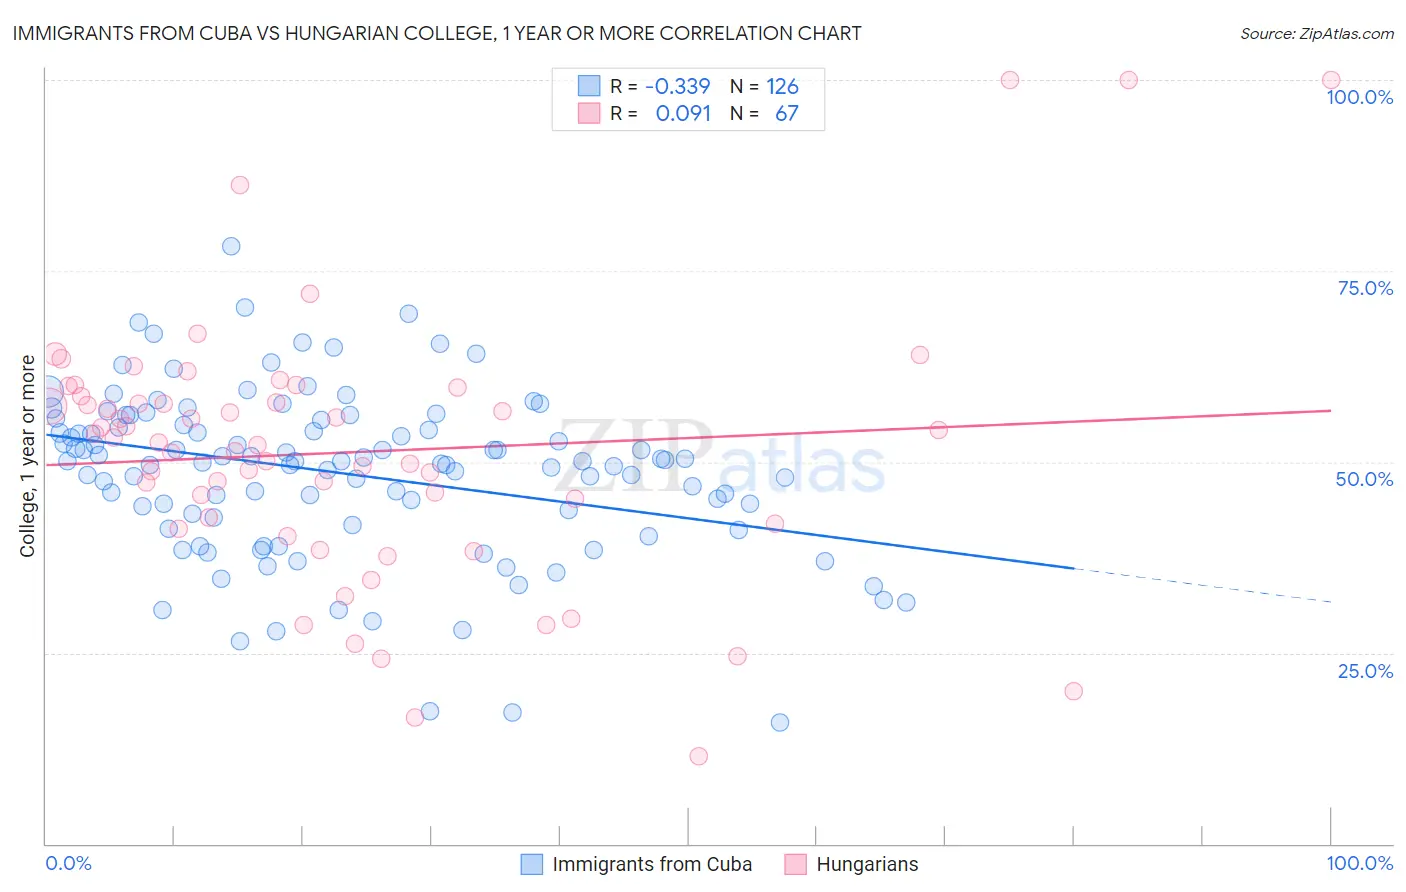
Immigrants from Cuba vs Hungarian College, 1 year or more Correlation Chart
The statistical analysis conducted on geographies consisting of 326,030,445 people shows a mild negative correlation between the proportion of Immigrants from Cuba and percentage of population with at least college, 1 year or more education in the United States with a correlation coefficient (R) of -0.339 and weighted average of 50.7%. Similarly, the statistical analysis conducted on geographies consisting of 486,237,030 people shows a slight positive correlation between the proportion of Hungarians and percentage of population with at least college, 1 year or more education in the United States with a correlation coefficient (R) of 0.091 and weighted average of 59.5%, a difference of 17.4%.
College, 1 year or more Correlation Summary
| Measurement | Immigrants from Cuba | Hungarian |
| Minimum | 15.9% | 11.5% |
| Maximum | 78.2% | 100.0% |
| Range | 62.3% | 88.5% |
| Mean | 48.5% | 51.3% |
| Median | 50.1% | 52.6% |
| Interquartile 25% (IQ1) | 42.7% | 41.8% |
| Interquartile 75% (IQ3) | 54.8% | 58.5% |
| Interquartile Range (IQR) | 12.2% | 16.7% |
| Standard Deviation (Sample) | 10.9% | 17.2% |
| Standard Deviation (Population) | 10.8% | 17.1% |
Similar Demographics by College, 1 year or more
Demographics Similar to Immigrants from Cuba by College, 1 year or more
In terms of college, 1 year or more, the demographic groups most similar to Immigrants from Cuba are Immigrants from Guatemala (50.7%, a difference of 0.010%), Immigrants from Latin America (50.7%, a difference of 0.030%), Dominican (50.6%, a difference of 0.21%), Navajo (50.8%, a difference of 0.24%), and Menominee (50.6%, a difference of 0.25%).
| Demographics | Rating | Rank | College, 1 year or more |
| Hispanics or Latinos | 0.0 /100 | #317 | Tragic 51.1% |
| Immigrants | Honduras | 0.0 /100 | #318 | Tragic 51.0% |
| Immigrants | El Salvador | 0.0 /100 | #319 | Tragic 51.0% |
| Kiowa | 0.0 /100 | #320 | Tragic 51.0% |
| Hopi | 0.0 /100 | #321 | Tragic 50.9% |
| Navajo | 0.0 /100 | #322 | Tragic 50.8% |
| Immigrants | Guatemala | 0.0 /100 | #323 | Tragic 50.7% |
| Immigrants | Cuba | 0.0 /100 | #324 | Tragic 50.7% |
| Immigrants | Latin America | 0.0 /100 | #325 | Tragic 50.7% |
| Dominicans | 0.0 /100 | #326 | Tragic 50.6% |
| Menominee | 0.0 /100 | #327 | Tragic 50.6% |
| Dutch West Indians | 0.0 /100 | #328 | Tragic 50.5% |
| Cape Verdeans | 0.0 /100 | #329 | Tragic 50.3% |
| Natives/Alaskans | 0.0 /100 | #330 | Tragic 50.2% |
| Immigrants | Yemen | 0.0 /100 | #331 | Tragic 50.0% |
Demographics Similar to Hungarians by College, 1 year or more
In terms of college, 1 year or more, the demographic groups most similar to Hungarians are Immigrants from North Macedonia (59.5%, a difference of 0.010%), Immigrants from Southern Europe (59.5%, a difference of 0.010%), Welsh (59.5%, a difference of 0.030%), Immigrants from Albania (59.5%, a difference of 0.030%), and Immigrants from Sierra Leone (59.5%, a difference of 0.040%).
| Demographics | Rating | Rank | College, 1 year or more |
| Somalis | 64.5 /100 | #161 | Good 59.9% |
| Koreans | 58.5 /100 | #162 | Average 59.7% |
| Immigrants | Somalia | 58.3 /100 | #163 | Average 59.7% |
| Belgians | 58.1 /100 | #164 | Average 59.7% |
| Irish | 56.1 /100 | #165 | Average 59.6% |
| Immigrants | Africa | 56.1 /100 | #166 | Average 59.6% |
| Immigrants | North Macedonia | 53.1 /100 | #167 | Average 59.5% |
| Hungarians | 52.9 /100 | #168 | Average 59.5% |
| Immigrants | Southern Europe | 52.7 /100 | #169 | Average 59.5% |
| Welsh | 52.4 /100 | #170 | Average 59.5% |
| Immigrants | Albania | 52.3 /100 | #171 | Average 59.5% |
| Immigrants | Sierra Leone | 52.2 /100 | #172 | Average 59.5% |
| Immigrants | Oceania | 51.2 /100 | #173 | Average 59.4% |
| Celtics | 50.0 /100 | #174 | Average 59.4% |
| Sri Lankans | 49.0 /100 | #175 | Average 59.4% |