Immigrants from Croatia vs Immigrants from El Salvador Doctorate Degree
COMPARE
Immigrants from Croatia
Immigrants from El Salvador
Doctorate Degree
Doctorate Degree Comparison
Immigrants from Croatia
Immigrants from El Salvador
2.1%
DOCTORATE DEGREE
96.8/ 100
METRIC RATING
114th/ 347
METRIC RANK
1.4%
DOCTORATE DEGREE
0.3/ 100
METRIC RATING
288th/ 347
METRIC RANK
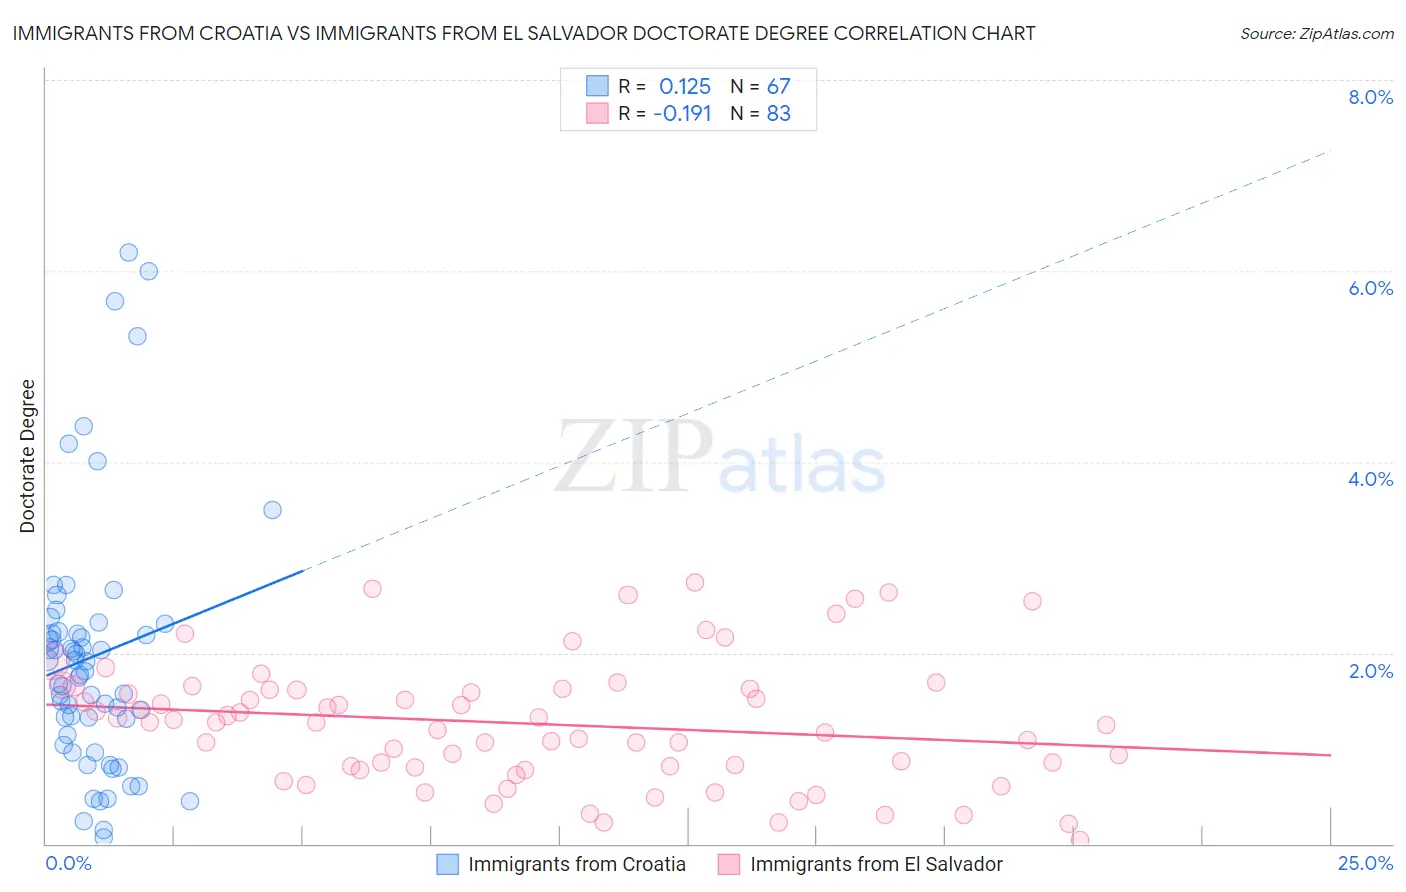
Immigrants from Croatia vs Immigrants from El Salvador Doctorate Degree Correlation Chart
The statistical analysis conducted on geographies consisting of 132,307,639 people shows a poor positive correlation between the proportion of Immigrants from Croatia and percentage of population with at least doctorate degree education in the United States with a correlation coefficient (R) of 0.125 and weighted average of 2.1%. Similarly, the statistical analysis conducted on geographies consisting of 353,263,202 people shows a poor negative correlation between the proportion of Immigrants from El Salvador and percentage of population with at least doctorate degree education in the United States with a correlation coefficient (R) of -0.191 and weighted average of 1.4%, a difference of 42.8%.
Doctorate Degree Correlation Summary
| Measurement | Immigrants from Croatia | Immigrants from El Salvador |
| Minimum | 0.064% | 0.038% |
| Maximum | 6.2% | 2.7% |
| Range | 6.1% | 2.7% |
| Mean | 2.0% | 1.3% |
| Median | 1.8% | 1.3% |
| Interquartile 25% (IQ1) | 1.1% | 0.80% |
| Interquartile 75% (IQ3) | 2.2% | 1.6% |
| Interquartile Range (IQR) | 1.1% | 0.82% |
| Standard Deviation (Sample) | 1.3% | 0.65% |
| Standard Deviation (Population) | 1.3% | 0.64% |
Similar Demographics by Doctorate Degree
Demographics Similar to Immigrants from Croatia by Doctorate Degree
In terms of doctorate degree, the demographic groups most similar to Immigrants from Croatia are Taiwanese (2.1%, a difference of 0.080%), Immigrants from Italy (2.1%, a difference of 0.15%), Syrian (2.1%, a difference of 0.37%), Immigrants from Pakistan (2.1%, a difference of 0.38%), and Brazilian (2.1%, a difference of 0.44%).
| Demographics | Rating | Rank | Doctorate Degree |
| Europeans | 97.5 /100 | #107 | Exceptional 2.1% |
| Immigrants | Germany | 97.3 /100 | #108 | Exceptional 2.1% |
| Ukrainians | 97.2 /100 | #109 | Exceptional 2.1% |
| Brazilians | 97.2 /100 | #110 | Exceptional 2.1% |
| Immigrants | Pakistan | 97.1 /100 | #111 | Exceptional 2.1% |
| Syrians | 97.1 /100 | #112 | Exceptional 2.1% |
| Immigrants | Italy | 96.9 /100 | #113 | Exceptional 2.1% |
| Immigrants | Croatia | 96.8 /100 | #114 | Exceptional 2.1% |
| Taiwanese | 96.7 /100 | #115 | Exceptional 2.1% |
| Maltese | 96.2 /100 | #116 | Exceptional 2.1% |
| Lebanese | 96.0 /100 | #117 | Exceptional 2.1% |
| Icelanders | 96.0 /100 | #118 | Exceptional 2.1% |
| Pakistanis | 95.8 /100 | #119 | Exceptional 2.0% |
| Immigrants | Morocco | 95.5 /100 | #120 | Exceptional 2.0% |
| Immigrants | Jordan | 94.8 /100 | #121 | Exceptional 2.0% |
Demographics Similar to Immigrants from El Salvador by Doctorate Degree
In terms of doctorate degree, the demographic groups most similar to Immigrants from El Salvador are Cape Verdean (1.4%, a difference of 0.14%), Choctaw (1.4%, a difference of 0.15%), Cajun (1.5%, a difference of 0.18%), Cherokee (1.5%, a difference of 0.34%), and Black/African American (1.4%, a difference of 0.38%).
| Demographics | Rating | Rank | Doctorate Degree |
| Tohono O'odham | 0.4 /100 | #281 | Tragic 1.5% |
| British West Indians | 0.3 /100 | #282 | Tragic 1.5% |
| Central Americans | 0.3 /100 | #283 | Tragic 1.5% |
| Jamaicans | 0.3 /100 | #284 | Tragic 1.5% |
| Malaysians | 0.3 /100 | #285 | Tragic 1.5% |
| Cherokee | 0.3 /100 | #286 | Tragic 1.5% |
| Cajuns | 0.3 /100 | #287 | Tragic 1.5% |
| Immigrants | El Salvador | 0.3 /100 | #288 | Tragic 1.4% |
| Cape Verdeans | 0.3 /100 | #289 | Tragic 1.4% |
| Choctaw | 0.3 /100 | #290 | Tragic 1.4% |
| Blacks/African Americans | 0.3 /100 | #291 | Tragic 1.4% |
| Alaska Natives | 0.3 /100 | #292 | Tragic 1.4% |
| Immigrants | Yemen | 0.2 /100 | #293 | Tragic 1.4% |
| Samoans | 0.2 /100 | #294 | Tragic 1.4% |
| Guatemalans | 0.2 /100 | #295 | Tragic 1.4% |