Immigrants from Croatia vs Tohono O'odham Doctorate Degree
COMPARE
Immigrants from Croatia
Tohono O'odham
Doctorate Degree
Doctorate Degree Comparison
Immigrants from Croatia
Tohono O'odham
2.1%
DOCTORATE DEGREE
96.8/ 100
METRIC RATING
114th/ 347
METRIC RANK
1.5%
DOCTORATE DEGREE
0.4/ 100
METRIC RATING
281st/ 347
METRIC RANK
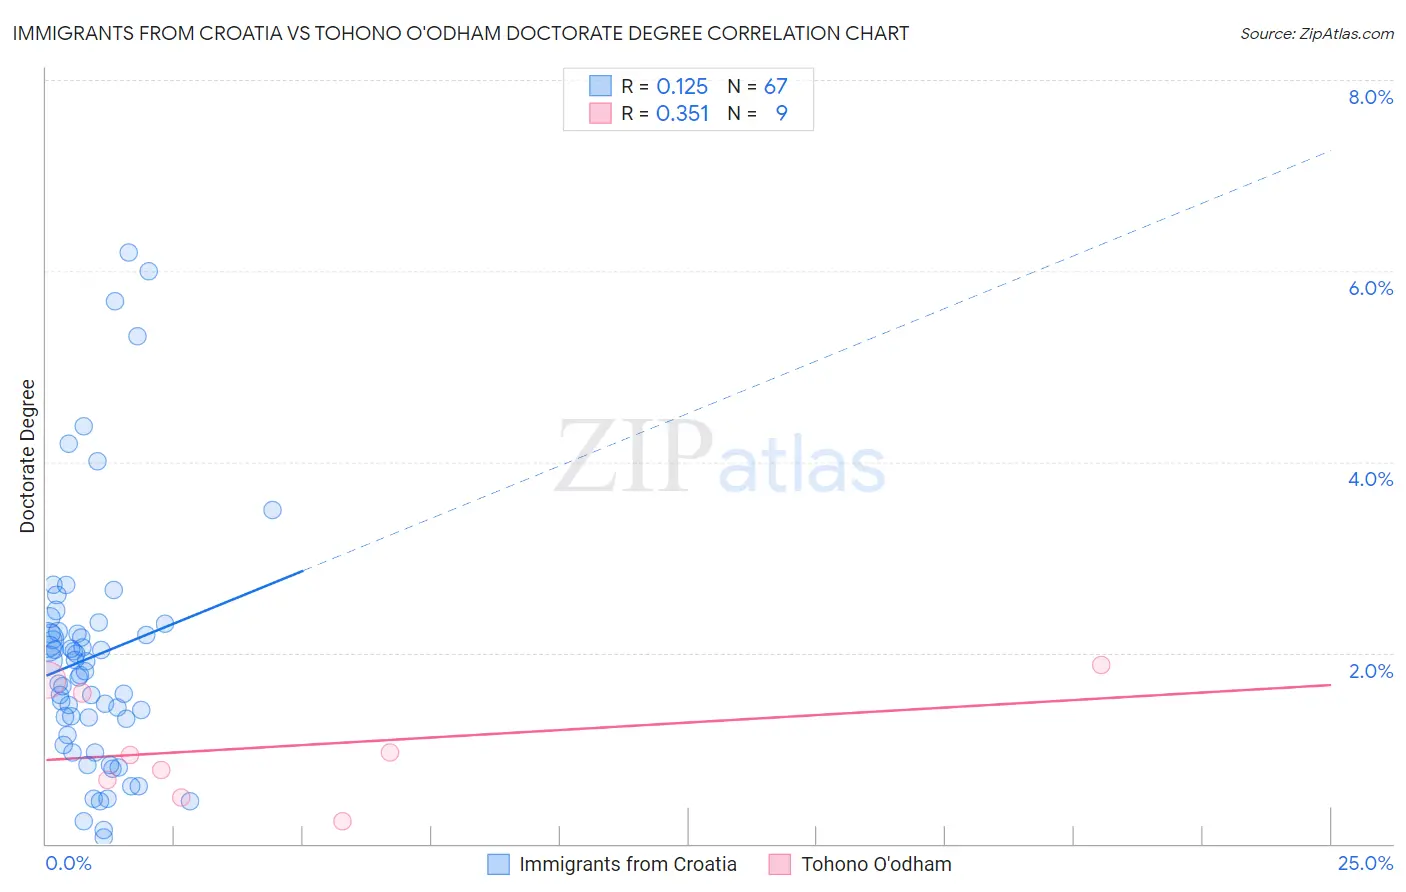
Immigrants from Croatia vs Tohono O'odham Doctorate Degree Correlation Chart
The statistical analysis conducted on geographies consisting of 132,307,639 people shows a poor positive correlation between the proportion of Immigrants from Croatia and percentage of population with at least doctorate degree education in the United States with a correlation coefficient (R) of 0.125 and weighted average of 2.1%. Similarly, the statistical analysis conducted on geographies consisting of 58,442,154 people shows a mild positive correlation between the proportion of Tohono O'odham and percentage of population with at least doctorate degree education in the United States with a correlation coefficient (R) of 0.351 and weighted average of 1.5%, a difference of 41.8%.
Doctorate Degree Correlation Summary
| Measurement | Immigrants from Croatia | Tohono O'odham |
| Minimum | 0.064% | 0.23% |
| Maximum | 6.2% | 1.9% |
| Range | 6.1% | 1.6% |
| Mean | 2.0% | 1.0% |
| Median | 1.8% | 0.93% |
| Interquartile 25% (IQ1) | 1.1% | 0.58% |
| Interquartile 75% (IQ3) | 2.2% | 1.6% |
| Interquartile Range (IQR) | 1.1% | 1.1% |
| Standard Deviation (Sample) | 1.3% | 0.57% |
| Standard Deviation (Population) | 1.3% | 0.54% |
Similar Demographics by Doctorate Degree
Demographics Similar to Immigrants from Croatia by Doctorate Degree
In terms of doctorate degree, the demographic groups most similar to Immigrants from Croatia are Taiwanese (2.1%, a difference of 0.080%), Immigrants from Italy (2.1%, a difference of 0.15%), Syrian (2.1%, a difference of 0.37%), Immigrants from Pakistan (2.1%, a difference of 0.38%), and Brazilian (2.1%, a difference of 0.44%).
| Demographics | Rating | Rank | Doctorate Degree |
| Europeans | 97.5 /100 | #107 | Exceptional 2.1% |
| Immigrants | Germany | 97.3 /100 | #108 | Exceptional 2.1% |
| Ukrainians | 97.2 /100 | #109 | Exceptional 2.1% |
| Brazilians | 97.2 /100 | #110 | Exceptional 2.1% |
| Immigrants | Pakistan | 97.1 /100 | #111 | Exceptional 2.1% |
| Syrians | 97.1 /100 | #112 | Exceptional 2.1% |
| Immigrants | Italy | 96.9 /100 | #113 | Exceptional 2.1% |
| Immigrants | Croatia | 96.8 /100 | #114 | Exceptional 2.1% |
| Taiwanese | 96.7 /100 | #115 | Exceptional 2.1% |
| Maltese | 96.2 /100 | #116 | Exceptional 2.1% |
| Lebanese | 96.0 /100 | #117 | Exceptional 2.1% |
| Icelanders | 96.0 /100 | #118 | Exceptional 2.1% |
| Pakistanis | 95.8 /100 | #119 | Exceptional 2.0% |
| Immigrants | Morocco | 95.5 /100 | #120 | Exceptional 2.0% |
| Immigrants | Jordan | 94.8 /100 | #121 | Exceptional 2.0% |
Demographics Similar to Tohono O'odham by Doctorate Degree
In terms of doctorate degree, the demographic groups most similar to Tohono O'odham are British West Indian (1.5%, a difference of 0.050%), Ecuadorian (1.5%, a difference of 0.060%), Marshallese (1.5%, a difference of 0.080%), Central American (1.5%, a difference of 0.10%), and Jamaican (1.5%, a difference of 0.14%).
| Demographics | Rating | Rank | Doctorate Degree |
| Yaqui | 0.4 /100 | #274 | Tragic 1.5% |
| Aleuts | 0.4 /100 | #275 | Tragic 1.5% |
| Paiute | 0.4 /100 | #276 | Tragic 1.5% |
| Bahamians | 0.4 /100 | #277 | Tragic 1.5% |
| Hawaiians | 0.4 /100 | #278 | Tragic 1.5% |
| Marshallese | 0.4 /100 | #279 | Tragic 1.5% |
| Ecuadorians | 0.4 /100 | #280 | Tragic 1.5% |
| Tohono O'odham | 0.4 /100 | #281 | Tragic 1.5% |
| British West Indians | 0.3 /100 | #282 | Tragic 1.5% |
| Central Americans | 0.3 /100 | #283 | Tragic 1.5% |
| Jamaicans | 0.3 /100 | #284 | Tragic 1.5% |
| Malaysians | 0.3 /100 | #285 | Tragic 1.5% |
| Cherokee | 0.3 /100 | #286 | Tragic 1.5% |
| Cajuns | 0.3 /100 | #287 | Tragic 1.5% |
| Immigrants | El Salvador | 0.3 /100 | #288 | Tragic 1.4% |