Immigrants from Croatia vs New Zealander Doctorate Degree
COMPARE
Immigrants from Croatia
New Zealander
Doctorate Degree
Doctorate Degree Comparison
Immigrants from Croatia
New Zealanders
2.1%
DOCTORATE DEGREE
96.8/ 100
METRIC RATING
114th/ 347
METRIC RANK
2.5%
DOCTORATE DEGREE
100.0/ 100
METRIC RATING
42nd/ 347
METRIC RANK
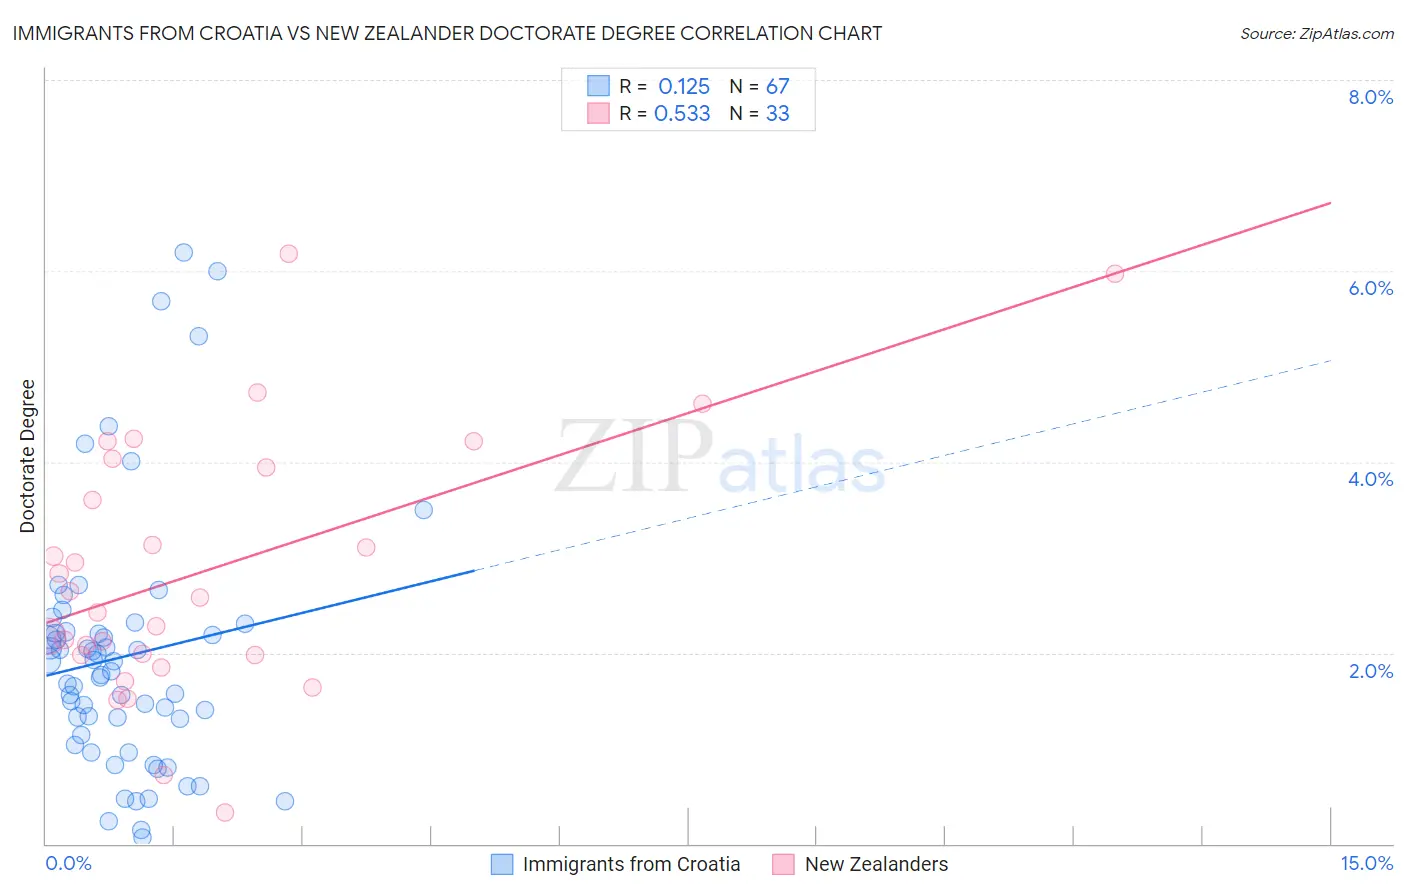
Immigrants from Croatia vs New Zealander Doctorate Degree Correlation Chart
The statistical analysis conducted on geographies consisting of 132,307,639 people shows a poor positive correlation between the proportion of Immigrants from Croatia and percentage of population with at least doctorate degree education in the United States with a correlation coefficient (R) of 0.125 and weighted average of 2.1%. Similarly, the statistical analysis conducted on geographies consisting of 106,690,602 people shows a substantial positive correlation between the proportion of New Zealanders and percentage of population with at least doctorate degree education in the United States with a correlation coefficient (R) of 0.533 and weighted average of 2.5%, a difference of 21.1%.
Doctorate Degree Correlation Summary
| Measurement | Immigrants from Croatia | New Zealander |
| Minimum | 0.064% | 0.33% |
| Maximum | 6.2% | 6.2% |
| Range | 6.1% | 5.9% |
| Mean | 2.0% | 2.9% |
| Median | 1.8% | 2.6% |
| Interquartile 25% (IQ1) | 1.1% | 2.0% |
| Interquartile 75% (IQ3) | 2.2% | 4.0% |
| Interquartile Range (IQR) | 1.1% | 2.0% |
| Standard Deviation (Sample) | 1.3% | 1.4% |
| Standard Deviation (Population) | 1.3% | 1.3% |
Similar Demographics by Doctorate Degree
Demographics Similar to Immigrants from Croatia by Doctorate Degree
In terms of doctorate degree, the demographic groups most similar to Immigrants from Croatia are Taiwanese (2.1%, a difference of 0.080%), Immigrants from Italy (2.1%, a difference of 0.15%), Syrian (2.1%, a difference of 0.37%), Immigrants from Pakistan (2.1%, a difference of 0.38%), and Brazilian (2.1%, a difference of 0.44%).
| Demographics | Rating | Rank | Doctorate Degree |
| Europeans | 97.5 /100 | #107 | Exceptional 2.1% |
| Immigrants | Germany | 97.3 /100 | #108 | Exceptional 2.1% |
| Ukrainians | 97.2 /100 | #109 | Exceptional 2.1% |
| Brazilians | 97.2 /100 | #110 | Exceptional 2.1% |
| Immigrants | Pakistan | 97.1 /100 | #111 | Exceptional 2.1% |
| Syrians | 97.1 /100 | #112 | Exceptional 2.1% |
| Immigrants | Italy | 96.9 /100 | #113 | Exceptional 2.1% |
| Immigrants | Croatia | 96.8 /100 | #114 | Exceptional 2.1% |
| Taiwanese | 96.7 /100 | #115 | Exceptional 2.1% |
| Maltese | 96.2 /100 | #116 | Exceptional 2.1% |
| Lebanese | 96.0 /100 | #117 | Exceptional 2.1% |
| Icelanders | 96.0 /100 | #118 | Exceptional 2.1% |
| Pakistanis | 95.8 /100 | #119 | Exceptional 2.0% |
| Immigrants | Morocco | 95.5 /100 | #120 | Exceptional 2.0% |
| Immigrants | Jordan | 94.8 /100 | #121 | Exceptional 2.0% |
Demographics Similar to New Zealanders by Doctorate Degree
In terms of doctorate degree, the demographic groups most similar to New Zealanders are Immigrants from Russia (2.5%, a difference of 0.63%), Soviet Union (2.5%, a difference of 0.94%), Estonian (2.5%, a difference of 0.96%), Immigrants from Netherlands (2.5%, a difference of 0.97%), and Immigrants from Ireland (2.5%, a difference of 1.4%).
| Demographics | Rating | Rank | Doctorate Degree |
| Immigrants | Malaysia | 100.0 /100 | #35 | Exceptional 2.6% |
| Immigrants | Spain | 100.0 /100 | #36 | Exceptional 2.6% |
| Immigrants | Kuwait | 100.0 /100 | #37 | Exceptional 2.6% |
| Russians | 100.0 /100 | #38 | Exceptional 2.6% |
| Immigrants | Ireland | 100.0 /100 | #39 | Exceptional 2.5% |
| Estonians | 100.0 /100 | #40 | Exceptional 2.5% |
| Immigrants | Russia | 100.0 /100 | #41 | Exceptional 2.5% |
| New Zealanders | 100.0 /100 | #42 | Exceptional 2.5% |
| Soviet Union | 100.0 /100 | #43 | Exceptional 2.5% |
| Immigrants | Netherlands | 100.0 /100 | #44 | Exceptional 2.5% |
| Immigrants | South Africa | 100.0 /100 | #45 | Exceptional 2.4% |
| Immigrants | Austria | 100.0 /100 | #46 | Exceptional 2.4% |
| Immigrants | Western Europe | 100.0 /100 | #47 | Exceptional 2.4% |
| Asians | 100.0 /100 | #48 | Exceptional 2.4% |
| Immigrants | Asia | 100.0 /100 | #49 | Exceptional 2.4% |