Immigrants from Croatia vs Cuban Doctorate Degree
COMPARE
Immigrants from Croatia
Cuban
Doctorate Degree
Doctorate Degree Comparison
Immigrants from Croatia
Cubans
2.1%
DOCTORATE DEGREE
96.8/ 100
METRIC RATING
114th/ 347
METRIC RANK
1.4%
DOCTORATE DEGREE
0.1/ 100
METRIC RATING
307th/ 347
METRIC RANK
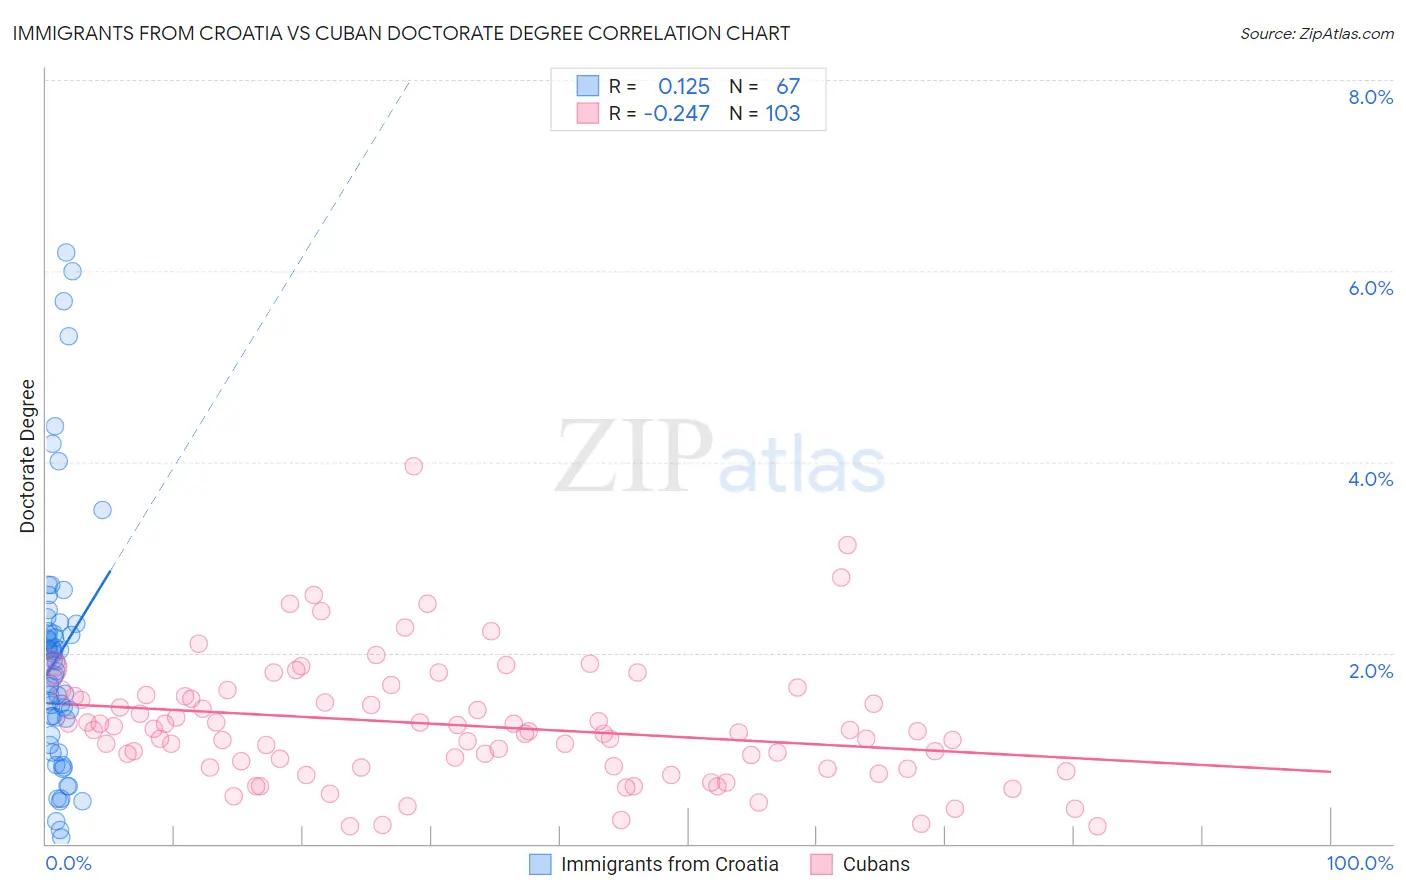
Immigrants from Croatia vs Cuban Doctorate Degree Correlation Chart
The statistical analysis conducted on geographies consisting of 132,307,639 people shows a poor positive correlation between the proportion of Immigrants from Croatia and percentage of population with at least doctorate degree education in the United States with a correlation coefficient (R) of 0.125 and weighted average of 2.1%. Similarly, the statistical analysis conducted on geographies consisting of 443,089,370 people shows a weak negative correlation between the proportion of Cubans and percentage of population with at least doctorate degree education in the United States with a correlation coefficient (R) of -0.247 and weighted average of 1.4%, a difference of 50.2%.
Doctorate Degree Correlation Summary
| Measurement | Immigrants from Croatia | Cuban |
| Minimum | 0.064% | 0.18% |
| Maximum | 6.2% | 4.0% |
| Range | 6.1% | 3.8% |
| Mean | 2.0% | 1.2% |
| Median | 1.8% | 1.2% |
| Interquartile 25% (IQ1) | 1.1% | 0.79% |
| Interquartile 75% (IQ3) | 2.2% | 1.6% |
| Interquartile Range (IQR) | 1.1% | 0.76% |
| Standard Deviation (Sample) | 1.3% | 0.65% |
| Standard Deviation (Population) | 1.3% | 0.65% |
Similar Demographics by Doctorate Degree
Demographics Similar to Immigrants from Croatia by Doctorate Degree
In terms of doctorate degree, the demographic groups most similar to Immigrants from Croatia are Taiwanese (2.1%, a difference of 0.080%), Immigrants from Italy (2.1%, a difference of 0.15%), Syrian (2.1%, a difference of 0.37%), Immigrants from Pakistan (2.1%, a difference of 0.38%), and Brazilian (2.1%, a difference of 0.44%).
| Demographics | Rating | Rank | Doctorate Degree |
| Europeans | 97.5 /100 | #107 | Exceptional 2.1% |
| Immigrants | Germany | 97.3 /100 | #108 | Exceptional 2.1% |
| Ukrainians | 97.2 /100 | #109 | Exceptional 2.1% |
| Brazilians | 97.2 /100 | #110 | Exceptional 2.1% |
| Immigrants | Pakistan | 97.1 /100 | #111 | Exceptional 2.1% |
| Syrians | 97.1 /100 | #112 | Exceptional 2.1% |
| Immigrants | Italy | 96.9 /100 | #113 | Exceptional 2.1% |
| Immigrants | Croatia | 96.8 /100 | #114 | Exceptional 2.1% |
| Taiwanese | 96.7 /100 | #115 | Exceptional 2.1% |
| Maltese | 96.2 /100 | #116 | Exceptional 2.1% |
| Lebanese | 96.0 /100 | #117 | Exceptional 2.1% |
| Icelanders | 96.0 /100 | #118 | Exceptional 2.1% |
| Pakistanis | 95.8 /100 | #119 | Exceptional 2.0% |
| Immigrants | Morocco | 95.5 /100 | #120 | Exceptional 2.0% |
| Immigrants | Jordan | 94.8 /100 | #121 | Exceptional 2.0% |
Demographics Similar to Cubans by Doctorate Degree
In terms of doctorate degree, the demographic groups most similar to Cubans are Immigrants from Laos (1.4%, a difference of 0.050%), Guyanese (1.4%, a difference of 0.25%), Pennsylvania German (1.4%, a difference of 0.26%), Mexican American Indian (1.4%, a difference of 0.40%), and Immigrants from Dominica (1.4%, a difference of 0.45%).
| Demographics | Rating | Rank | Doctorate Degree |
| Immigrants | Guatemala | 0.1 /100 | #300 | Tragic 1.4% |
| Hondurans | 0.1 /100 | #301 | Tragic 1.4% |
| Shoshone | 0.1 /100 | #302 | Tragic 1.4% |
| Immigrants | Dominica | 0.1 /100 | #303 | Tragic 1.4% |
| Mexican American Indians | 0.1 /100 | #304 | Tragic 1.4% |
| Pennsylvania Germans | 0.1 /100 | #305 | Tragic 1.4% |
| Guyanese | 0.1 /100 | #306 | Tragic 1.4% |
| Cubans | 0.1 /100 | #307 | Tragic 1.4% |
| Immigrants | Laos | 0.1 /100 | #308 | Tragic 1.4% |
| Immigrants | Grenada | 0.1 /100 | #309 | Tragic 1.4% |
| Immigrants | Jamaica | 0.1 /100 | #310 | Tragic 1.4% |
| Immigrants | Honduras | 0.1 /100 | #311 | Tragic 1.4% |
| Immigrants | Nicaragua | 0.1 /100 | #312 | Tragic 1.4% |
| Menominee | 0.1 /100 | #313 | Tragic 1.4% |
| Dominicans | 0.1 /100 | #314 | Tragic 1.4% |