Italian vs Dutch College, Under 1 year

COMPARE

Italian
Race
Ancestry
AfghanAfricanAlaska NativeAlaskan AthabascanAlbanianAleutAlsatianAmericanApacheArabArapahoArgentineanArmenianAssyrian/Chaldean/SyriacAustralianAustrianBahamianBangladeshiBarbadianBasqueBelgianBelizeanBermudanBhutaneseBlackfeetBolivianBrazilianBritishBritish West IndianBulgarianBurmeseCajunCambodianCanadianCape VerdeanCarpatho RusynCelticCentral AmericanCentral American IndianCherokeeCheyenneChickasawChileanChineseChippewaChoctawColombianColvilleComancheCosta RicanCreeCreekCroatianCrowCubanCypriotCzechCzechoslovakianDanishDelawareDominicanDutch West IndianEastern EuropeanEcuadorianEgyptianEnglishEstonianEthiopianEuropeanFijianFilipinoFinnishFrenchFrench American IndianFrench CanadianGermanGerman RussianGhanaianGreekGuamanian/ChamorroGuatemalanGuyaneseHaitianHmongHonduranHopiHoumaHungarianIcelanderIndian (Asian)IndonesianInupiatIranianIraqiIrishIroquoisIsraeliItalianJamaicanJapaneseJordanianKenyanKiowaKoreanLaotianLatvianLebaneseLiberianLithuanianLumbeeLuxembourgerMacedonianMalaysianMalteseMarshalleseMenomineeMexicanMexican American IndianMongolianMoroccanNative HawaiianNavajoNepaleseNew ZealanderNicaraguanNigerianNorthern EuropeanNorwegianOkinawanOsageOttawaPaiutePakistaniPalestinianPanamanianParaguayanPennsylvania GermanPeruvianPimaPolishPortuguesePotawatomiPuebloPuerto RicanPuget Sound SalishRomanianRussianSalvadoranSamoanScandinavianScotch-IrishScottishSeminoleSenegaleseSerbianShoshoneSierra LeoneanSiouxSlavicSlovakSloveneSomaliSouth AfricanSouth AmericanSouth American IndianSoviet UnionSpaniardSpanishSpanish AmericanSpanish American IndianSri LankanSubsaharan AfricanSudaneseSwedishSwissSyrianTaiwaneseThaiTlingit-HaidaTohono O'OdhamTonganTrinidadian and TobagonianTsimshianTurkishU.S. Virgin IslanderUgandanUkrainianUruguayanUteVenezuelanVietnameseWelshWest IndianYakamaYaquiYugoslavianYumanYup'ikZimbabwean
Immigration
NonimmigrantsImmigrantsAfghanistanAfricaAlbaniaArgentinaArmeniaAsiaAustraliaAustriaBahamasBangladeshBarbadosBelarusBelgiumBelizeBoliviaBosnia and HerzegovinaBrazilBulgariaBurma/MyanmarCabo VerdeCambodiaCameroonCanadaCaribbeanCentral AmericaChileChinaColombiaCongoCosta RicaCroatiaCubaCzechoslovakiaDenmarkDominicaDominican RepublicEastern AfricaEastern AsiaEastern EuropeEcuadorEgyptEl SalvadorEnglandEritreaEthiopiaEuropeFijiFranceGermanyGhanaGreeceGrenadaGuatemalaGuyanaHaitiHondurasHong KongHungaryIndiaIndonesiaIranIraqIrelandIsraelItalyJamaicaJapanJordanKazakhstanKenyaKoreaKuwaitLaosLatin AmericaLatviaLebanonLiberiaLithuaniaMalaysiaMexicoMicronesiaMiddle AfricaMoldovaMoroccoNepalNetherlandsNicaraguaNigeriaNorth AmericaNorth MacedoniaNorthern AfricaNorthern EuropeNorwayOceaniaPakistanPanamaPeruPhilippinesPolandPortugalRomaniaRussiaSaudi ArabiaScotlandSenegalSerbiaSierra LeoneSingaporeSomaliaSouth AfricaSouth AmericaSouth Central AsiaSouth Eastern AsiaSouthern EuropeSpainSri LankaSt. Vincent and the GrenadinesSudanSwedenSwitzerlandSyriaTaiwanThailandTrinidad and TobagoTurkeyUgandaUkraineUruguayUzbekistanVenezuelaVietnamWest IndiesWestern AfricaWestern AsiaWestern EuropeYemenZaireZimbabweAzores
Dutch
Race
Ancestry
AfghanAfricanAlaska NativeAlaskan AthabascanAlbanianAleutAlsatianAmericanApacheArabArapahoArgentineanArmenianAssyrian/Chaldean/SyriacAustralianAustrianBahamianBangladeshiBarbadianBasqueBelgianBelizeanBermudanBhutaneseBlackfeetBolivianBrazilianBritishBritish West IndianBulgarianBurmeseCajunCambodianCanadianCape VerdeanCarpatho RusynCelticCentral AmericanCentral American IndianCherokeeCheyenneChickasawChileanChineseChippewaChoctawColombianColvilleComancheCosta RicanCreeCreekCroatianCrowCubanCypriotCzechCzechoslovakianDanishDelawareDominicanDutchDutch West IndianEastern EuropeanEcuadorianEgyptianEnglishEstonianEthiopianEuropeanFijianFilipinoFinnishFrenchFrench American IndianFrench CanadianGermanGerman RussianGhanaianGreekGuamanian/ChamorroGuatemalanGuyaneseHaitianHmongHonduranHopiHoumaHungarianIcelanderIndian (Asian)IndonesianInupiatIranianIraqiIrishIroquoisIsraeliJamaicanJapaneseJordanianKenyanKiowaKoreanLaotianLatvianLebaneseLiberianLithuanianLumbeeLuxembourgerMacedonianMalaysianMalteseMarshalleseMenomineeMexicanMexican American IndianMongolianMoroccanNative HawaiianNavajoNepaleseNew ZealanderNicaraguanNigerianNorthern EuropeanNorwegianOkinawanOsageOttawaPaiutePakistaniPalestinianPanamanianParaguayanPennsylvania GermanPeruvianPimaPolishPortuguesePotawatomiPuebloPuerto RicanPuget Sound SalishRomanianRussianSalvadoranSamoanScandinavianScotch-IrishScottishSeminoleSenegaleseSerbianShoshoneSierra LeoneanSiouxSlavicSlovakSloveneSomaliSouth AfricanSouth AmericanSouth American IndianSoviet UnionSpaniardSpanishSpanish AmericanSpanish American IndianSri LankanSubsaharan AfricanSudaneseSwedishSwissSyrianTaiwaneseThaiTlingit-HaidaTohono O'OdhamTonganTrinidadian and TobagonianTsimshianTurkishU.S. Virgin IslanderUgandanUkrainianUruguayanUteVenezuelanVietnameseWelshWest IndianYakamaYaquiYugoslavianYumanYup'ikZimbabwean
Immigration
NonimmigrantsImmigrantsAfghanistanAfricaAlbaniaArgentinaArmeniaAsiaAustraliaAustriaBahamasBangladeshBarbadosBelarusBelgiumBelizeBoliviaBosnia and HerzegovinaBrazilBulgariaBurma/MyanmarCabo VerdeCambodiaCameroonCanadaCaribbeanCentral AmericaChileChinaColombiaCongoCosta RicaCroatiaCubaCzechoslovakiaDenmarkDominicaDominican RepublicEastern AfricaEastern AsiaEastern EuropeEcuadorEgyptEl SalvadorEnglandEritreaEthiopiaEuropeFijiFranceGermanyGhanaGreeceGrenadaGuatemalaGuyanaHaitiHondurasHong KongHungaryIndiaIndonesiaIranIraqIrelandIsraelItalyJamaicaJapanJordanKazakhstanKenyaKoreaKuwaitLaosLatin AmericaLatviaLebanonLiberiaLithuaniaMalaysiaMexicoMicronesiaMiddle AfricaMoldovaMoroccoNepalNetherlandsNicaraguaNigeriaNorth AmericaNorth MacedoniaNorthern AfricaNorthern EuropeNorwayOceaniaPakistanPanamaPeruPhilippinesPolandPortugalRomaniaRussiaSaudi ArabiaScotlandSenegalSerbiaSierra LeoneSingaporeSomaliaSouth AfricaSouth AmericaSouth Central AsiaSouth Eastern AsiaSouthern EuropeSpainSri LankaSt. Vincent and the GrenadinesSudanSwedenSwitzerlandSyriaTaiwanThailandTrinidad and TobagoTurkeyUgandaUkraineUruguayUzbekistanVenezuelaVietnamWest IndiesWestern AfricaWestern AsiaWestern EuropeYemenZaireZimbabweAzores
College, Under 1 year
Income
Poverty
Unemployment
Labor Participation
Family Structure
Vehicle Availability
Education Level
Disability

College, Under 1 year Comparison

Italians

Dutch

Exceptional
Average
67.2%
COLLEGE, UNDER 1 YEAR
91.8/ 100
METRIC RATING
125th/ 347
METRIC RANK
65.3%
COLLEGE, UNDER 1 YEAR
46.1/ 100
METRIC RATING
180th/ 347
METRIC RANK

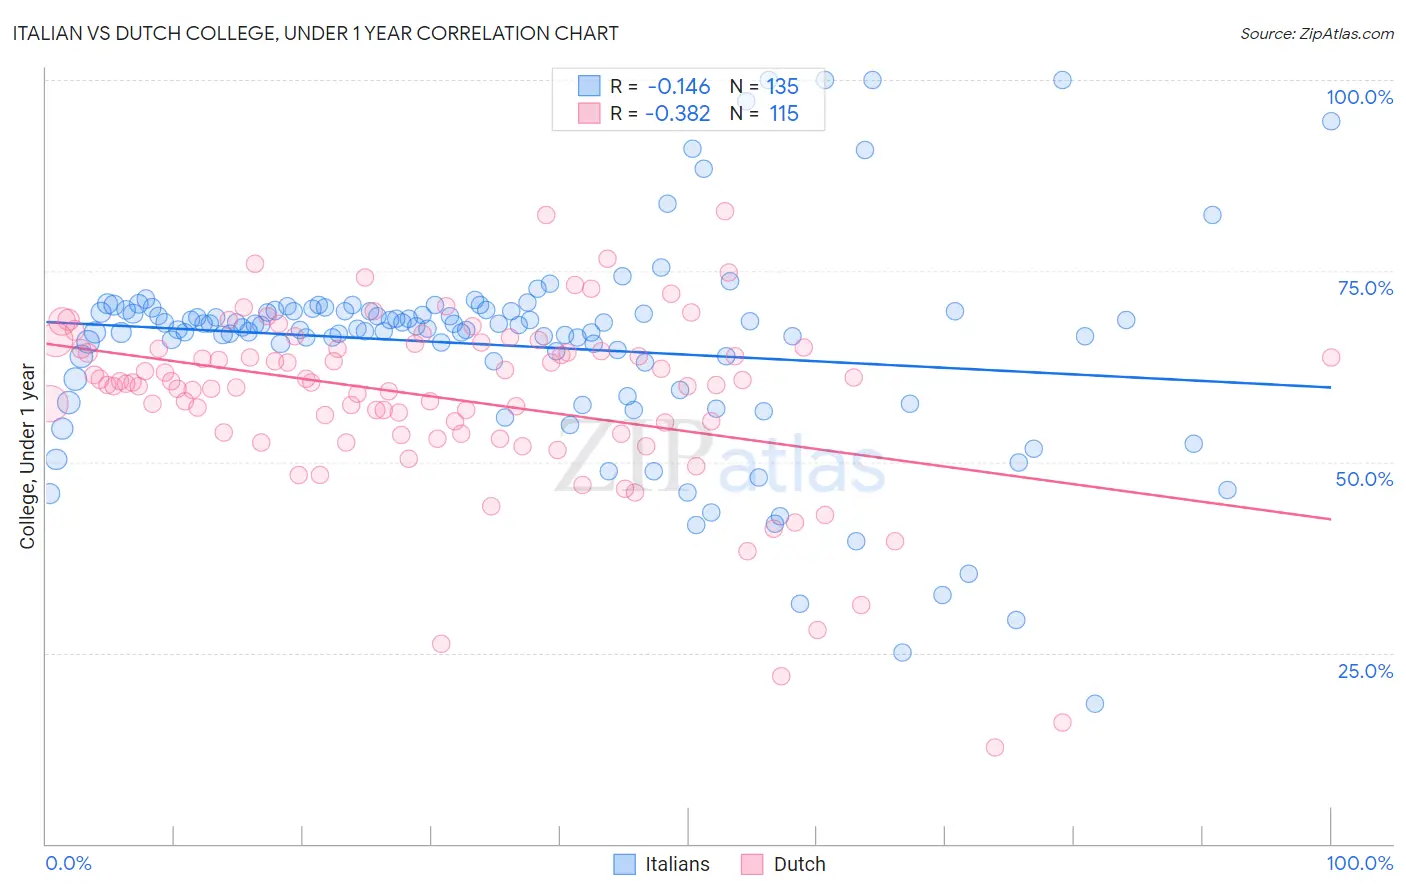
Italian vs Dutch College, Under 1 year Correlation Chart

The statistical analysis conducted on geographies consisting of 575,108,036 people shows a poor negative correlation between the proportion of Italians and percentage of population with at least college, under 1 year education in the United States with a correlation coefficient (R) of -0.146 and weighted average of 67.2%. Similarly, the statistical analysis conducted on geographies consisting of 554,354,714 people shows a mild negative correlation between the proportion of Dutch and percentage of population with at least college, under 1 year education in the United States with a correlation coefficient (R) of -0.382 and weighted average of 65.3%, a difference of 2.8%.
Italian vs Dutch College, Under 1 year

College, Under 1 year Correlation Summary

MeasurementItalianDutch
Minimum18.4%12.6%
Maximum100.0%82.8%
Range81.6%70.1%
Mean65.2%58.4%
Median67.5%60.4%
Interquartile 25% (IQ1)63.1%53.7%
Interquartile 75% (IQ3)69.8%64.8%
Interquartile Range (IQR)6.7%11.1%
Standard Deviation (Sample)13.7%11.9%
Standard Deviation (Population)13.6%11.8%

Similar Demographics by College, Under 1 year

Demographics Similar to Italians by College, Under 1 year

In terms of college, under 1 year, the demographic groups most similar to Italians are Alsatian (67.1%, a difference of 0.060%), Arab (67.2%, a difference of 0.12%), Immigrants from Northern Africa (67.2%, a difference of 0.13%), Czech (67.1%, a difference of 0.14%), and Immigrants from Jordan (67.3%, a difference of 0.15%).
DemographicsRating | RankCollege, Under 1 year
Immigrants | Ukraine
94.7
/100
|
#118
Exceptional
67.5%
Lebanese
94.6
/100
|
#119
Exceptional
67.5%
Serbians
93.9
/100
|
#120
Exceptional
67.4%
Slovenes
93.3
/100
|
#121
Exceptional
67.3%
Immigrants | Jordan
92.8
/100
|
#122
Exceptional
67.3%
Immigrants | Northern Africa
92.7
/100
|
#123
Exceptional
67.2%
Arabs
92.6
/100
|
#124
Exceptional
67.2%
Italians
91.8
/100
|
#125
Exceptional
67.2%
Alsatians
91.3
/100
|
#126
Exceptional
67.1%
Czechs
90.8
/100
|
#127
Exceptional
67.1%
Scottish
90.2
/100
|
#128
Exceptional
67.0%
Immigrants | Eastern Africa
89.5
/100
|
#129
Excellent
67.0%
Immigrants | Syria
89.0
/100
|
#130
Excellent
66.9%
Finns
88.6
/100
|
#131
Excellent
66.9%
Poles
88.4
/100
|
#132
Excellent
66.9%

Demographics Similar to Dutch by College, Under 1 year

In terms of college, under 1 year, the demographic groups most similar to Dutch are Spaniard (65.3%, a difference of 0.030%), Immigrants from Africa (65.3%, a difference of 0.060%), Guamanian/Chamorro (65.4%, a difference of 0.090%), German Russian (65.4%, a difference of 0.10%), and Immigrants from North Macedonia (65.4%, a difference of 0.11%).
DemographicsRating | RankCollege, Under 1 year
Swiss
53.9
/100
|
#173
Average
65.5%
Immigrants | Bosnia and Herzegovina
50.0
/100
|
#174
Average
65.4%
Scotch-Irish
49.5
/100
|
#175
Average
65.4%
French
48.9
/100
|
#176
Average
65.4%
Immigrants | North Macedonia
48.6
/100
|
#177
Average
65.4%
German Russians
48.3
/100
|
#178
Average
65.4%
Guamanians/Chamorros
48.2
/100
|
#179
Average
65.4%
Dutch
46.1
/100
|
#180
Average
65.3%
Spaniards
45.5
/100
|
#181
Average
65.3%
Immigrants | Africa
44.7
/100
|
#182
Average
65.3%
Immigrants | Poland
42.6
/100
|
#183
Average
65.2%
Bermudans
42.0
/100
|
#184
Average
65.2%
Sri Lankans
41.7
/100
|
#185
Average
65.2%
Immigrants | Sierra Leone
39.7
/100
|
#186
Fair
65.1%
Immigrants | Southern Europe
34.3
/100
|
#187
Fair
64.9%