Trinidadian and Tobagonian vs Immigrants from North America College, Under 1 year
COMPARE
Trinidadian and Tobagonian
Immigrants from North America
College, Under 1 year
College, Under 1 year Comparison
Trinidadians and Tobagonians
Immigrants from North America
61.1%
COLLEGE, UNDER 1 YEAR
0.2/ 100
METRIC RATING
264th/ 347
METRIC RANK
69.0%
COLLEGE, UNDER 1 YEAR
99.3/ 100
METRIC RATING
66th/ 347
METRIC RANK
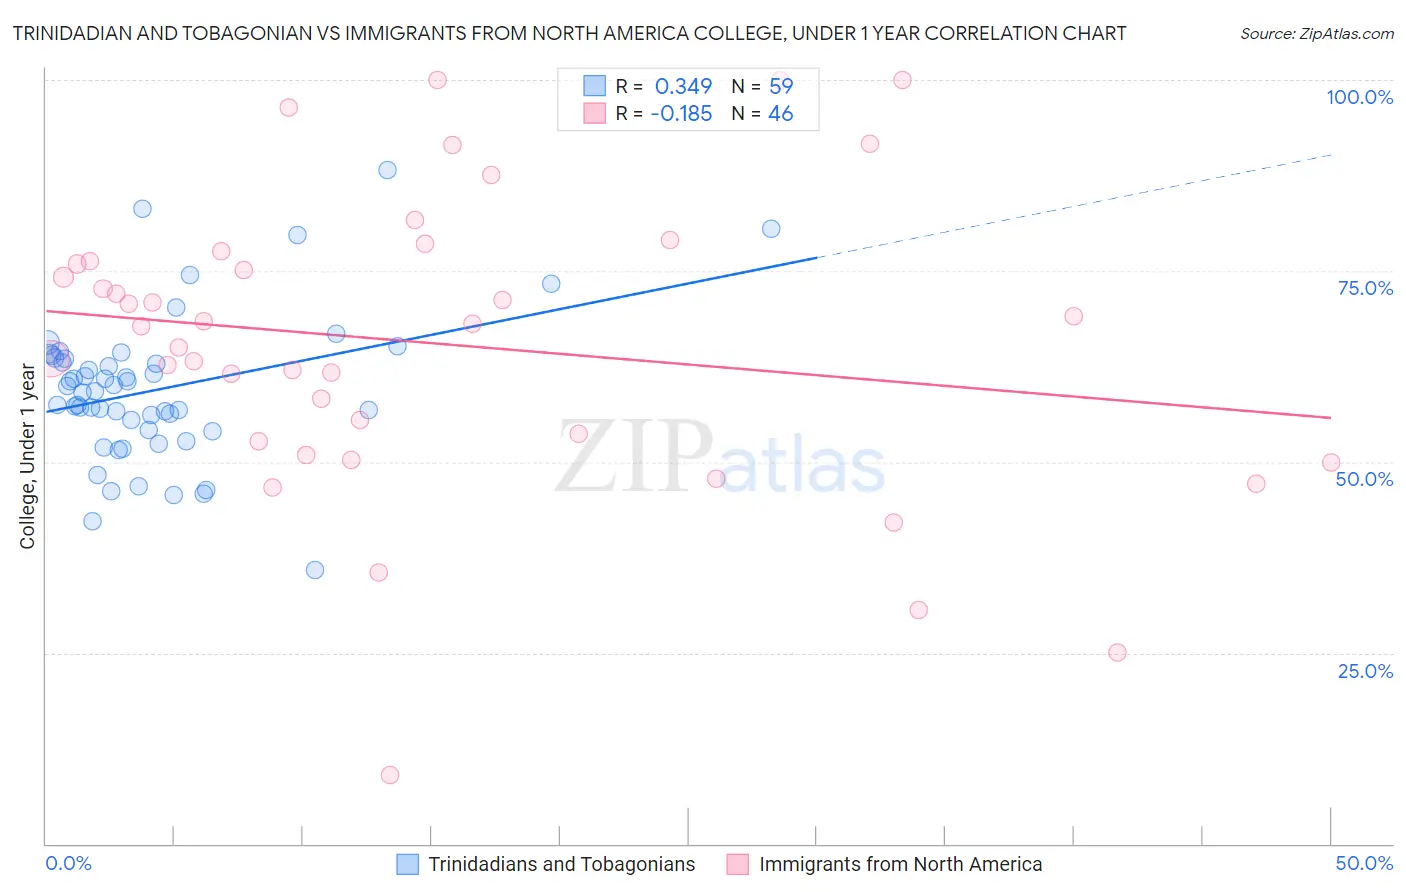
Trinidadian and Tobagonian vs Immigrants from North America College, Under 1 year Correlation Chart
The statistical analysis conducted on geographies consisting of 219,882,137 people shows a mild positive correlation between the proportion of Trinidadians and Tobagonians and percentage of population with at least college, under 1 year education in the United States with a correlation coefficient (R) of 0.349 and weighted average of 61.1%. Similarly, the statistical analysis conducted on geographies consisting of 462,457,398 people shows a poor negative correlation between the proportion of Immigrants from North America and percentage of population with at least college, under 1 year education in the United States with a correlation coefficient (R) of -0.185 and weighted average of 69.0%, a difference of 13.0%.
College, Under 1 year Correlation Summary
| Measurement | Trinidadian and Tobagonian | Immigrants from North America |
| Minimum | 35.8% | 9.0% |
| Maximum | 88.2% | 100.0% |
| Range | 52.3% | 91.0% |
| Mean | 59.5% | 65.5% |
| Median | 59.2% | 67.9% |
| Interquartile 25% (IQ1) | 54.1% | 52.7% |
| Interquartile 75% (IQ3) | 63.6% | 76.3% |
| Interquartile Range (IQR) | 9.5% | 23.6% |
| Standard Deviation (Sample) | 9.6% | 19.7% |
| Standard Deviation (Population) | 9.5% | 19.5% |
Similar Demographics by College, Under 1 year
Demographics Similar to Trinidadians and Tobagonians by College, Under 1 year
In terms of college, under 1 year, the demographic groups most similar to Trinidadians and Tobagonians are Immigrants from Bahamas (61.1%, a difference of 0.0%), Shoshone (61.1%, a difference of 0.060%), Barbadian (61.1%, a difference of 0.070%), African (61.1%, a difference of 0.11%), and Alaskan Athabascan (61.0%, a difference of 0.12%).
| Demographics | Rating | Rank | College, Under 1 year |
| Immigrants | Laos | 0.3 /100 | #257 | Tragic 61.3% |
| Immigrants | Bangladesh | 0.3 /100 | #258 | Tragic 61.3% |
| Indonesians | 0.3 /100 | #259 | Tragic 61.2% |
| Blackfeet | 0.3 /100 | #260 | Tragic 61.1% |
| Africans | 0.3 /100 | #261 | Tragic 61.1% |
| Barbadians | 0.2 /100 | #262 | Tragic 61.1% |
| Shoshone | 0.2 /100 | #263 | Tragic 61.1% |
| Trinidadians and Tobagonians | 0.2 /100 | #264 | Tragic 61.1% |
| Immigrants | Bahamas | 0.2 /100 | #265 | Tragic 61.1% |
| Alaskan Athabascans | 0.2 /100 | #266 | Tragic 61.0% |
| Americans | 0.2 /100 | #267 | Tragic 61.0% |
| Immigrants | Trinidad and Tobago | 0.1 /100 | #268 | Tragic 60.7% |
| Immigrants | West Indies | 0.1 /100 | #269 | Tragic 60.6% |
| Cheyenne | 0.1 /100 | #270 | Tragic 60.6% |
| U.S. Virgin Islanders | 0.1 /100 | #271 | Tragic 60.6% |
Demographics Similar to Immigrants from North America by College, Under 1 year
In terms of college, under 1 year, the demographic groups most similar to Immigrants from North America are Immigrants from Moldova (69.0%, a difference of 0.030%), Northern European (69.0%, a difference of 0.040%), Immigrants from Canada (69.1%, a difference of 0.080%), Immigrants from Zimbabwe (68.9%, a difference of 0.14%), and Immigrants from Indonesia (68.9%, a difference of 0.17%).
| Demographics | Rating | Rank | College, Under 1 year |
| Immigrants | Serbia | 99.5 /100 | #59 | Exceptional 69.3% |
| Immigrants | Asia | 99.5 /100 | #60 | Exceptional 69.2% |
| Immigrants | Kazakhstan | 99.5 /100 | #61 | Exceptional 69.2% |
| Immigrants | Belarus | 99.5 /100 | #62 | Exceptional 69.2% |
| Immigrants | Canada | 99.4 /100 | #63 | Exceptional 69.1% |
| Northern Europeans | 99.4 /100 | #64 | Exceptional 69.0% |
| Immigrants | Moldova | 99.3 /100 | #65 | Exceptional 69.0% |
| Immigrants | North America | 99.3 /100 | #66 | Exceptional 69.0% |
| Immigrants | Zimbabwe | 99.2 /100 | #67 | Exceptional 68.9% |
| Immigrants | Indonesia | 99.2 /100 | #68 | Exceptional 68.9% |
| Immigrants | Romania | 99.2 /100 | #69 | Exceptional 68.9% |
| Lithuanians | 99.1 /100 | #70 | Exceptional 68.8% |
| Immigrants | Europe | 99.1 /100 | #71 | Exceptional 68.8% |
| Bolivians | 99.0 /100 | #72 | Exceptional 68.7% |
| Immigrants | England | 99.0 /100 | #73 | Exceptional 68.7% |