Immigrants from Colombia vs Yaqui Professional Degree
COMPARE
Immigrants from Colombia
Yaqui
Professional Degree
Professional Degree Comparison
Immigrants from Colombia
Yaqui
4.5%
PROFESSIONAL DEGREE
59.4/ 100
METRIC RATING
166th/ 347
METRIC RANK
3.2%
PROFESSIONAL DEGREE
0.0/ 100
METRIC RATING
325th/ 347
METRIC RANK
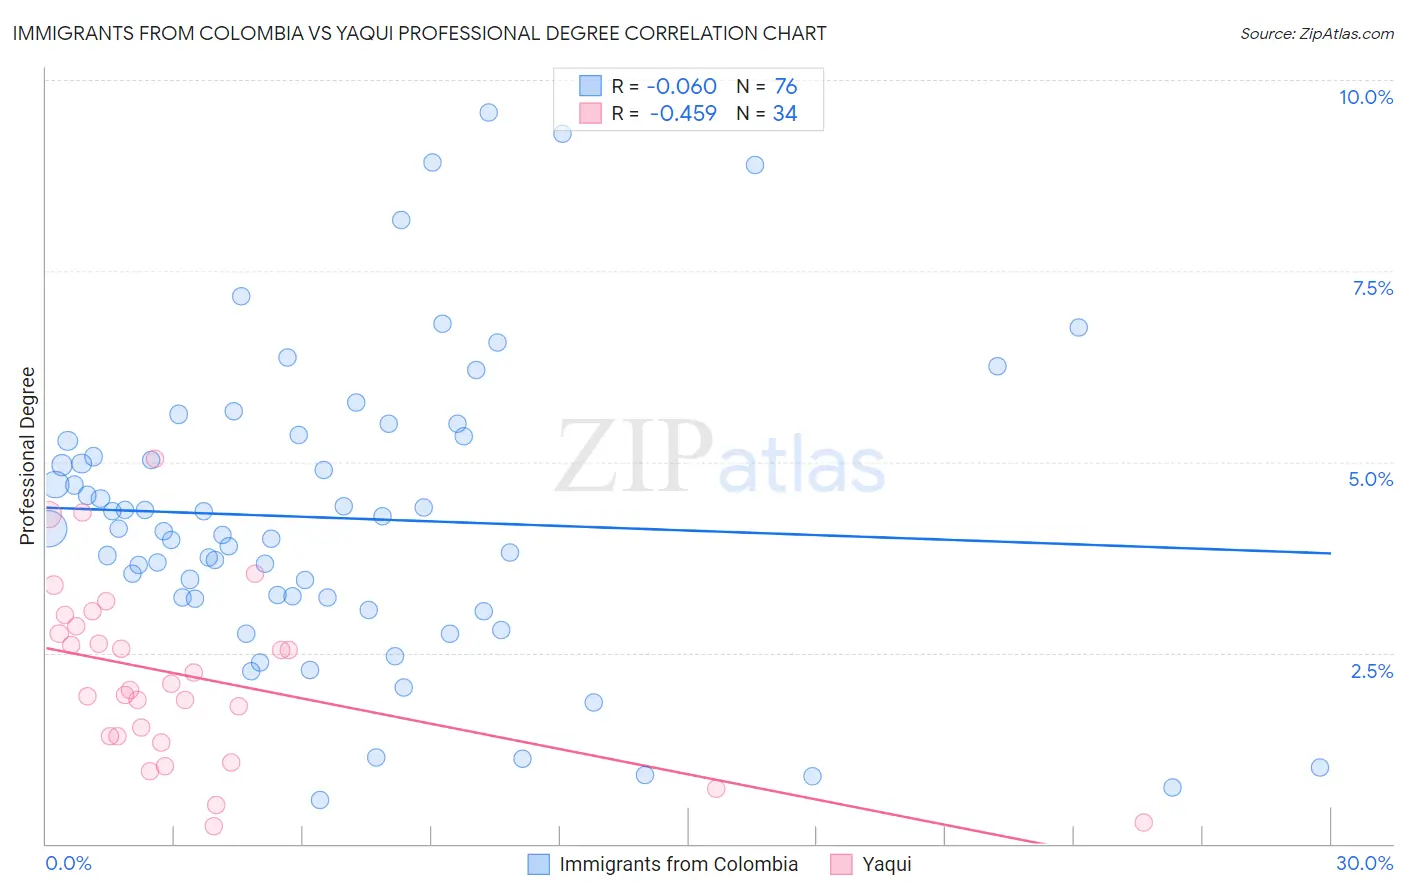
Immigrants from Colombia vs Yaqui Professional Degree Correlation Chart
The statistical analysis conducted on geographies consisting of 378,013,627 people shows a slight negative correlation between the proportion of Immigrants from Colombia and percentage of population with at least professional degree education in the United States with a correlation coefficient (R) of -0.060 and weighted average of 4.5%. Similarly, the statistical analysis conducted on geographies consisting of 107,544,559 people shows a moderate negative correlation between the proportion of Yaqui and percentage of population with at least professional degree education in the United States with a correlation coefficient (R) of -0.459 and weighted average of 3.2%, a difference of 41.5%.
Professional Degree Correlation Summary
| Measurement | Immigrants from Colombia | Yaqui |
| Minimum | 0.57% | 0.22% |
| Maximum | 9.6% | 5.0% |
| Range | 9.0% | 4.8% |
| Mean | 4.3% | 2.2% |
| Median | 4.1% | 2.1% |
| Interquartile 25% (IQ1) | 3.2% | 1.4% |
| Interquartile 75% (IQ3) | 5.3% | 2.9% |
| Interquartile Range (IQR) | 2.1% | 1.5% |
| Standard Deviation (Sample) | 2.0% | 1.2% |
| Standard Deviation (Population) | 2.0% | 1.1% |
Similar Demographics by Professional Degree
Demographics Similar to Immigrants from Colombia by Professional Degree
In terms of professional degree, the demographic groups most similar to Immigrants from Colombia are Immigrants from Afghanistan (4.5%, a difference of 0.030%), Costa Rican (4.5%, a difference of 0.080%), Immigrants from Sierra Leone (4.5%, a difference of 0.10%), Chinese (4.5%, a difference of 0.11%), and Swiss (4.5%, a difference of 0.24%).
| Demographics | Rating | Rank | Professional Degree |
| Vietnamese | 68.4 /100 | #159 | Good 4.5% |
| Immigrants | Senegal | 68.0 /100 | #160 | Good 4.5% |
| Assyrians/Chaldeans/Syriacs | 67.4 /100 | #161 | Good 4.5% |
| Peruvians | 65.2 /100 | #162 | Good 4.5% |
| Sierra Leoneans | 64.3 /100 | #163 | Good 4.5% |
| Swiss | 61.0 /100 | #164 | Good 4.5% |
| Costa Ricans | 59.9 /100 | #165 | Average 4.5% |
| Immigrants | Colombia | 59.4 /100 | #166 | Average 4.5% |
| Immigrants | Afghanistan | 59.2 /100 | #167 | Average 4.5% |
| Immigrants | Sierra Leone | 58.7 /100 | #168 | Average 4.5% |
| Chinese | 58.6 /100 | #169 | Average 4.5% |
| Immigrants | Zaire | 57.4 /100 | #170 | Average 4.5% |
| Immigrants | Bangladesh | 56.0 /100 | #171 | Average 4.4% |
| Spaniards | 52.0 /100 | #172 | Average 4.4% |
| English | 50.1 /100 | #173 | Average 4.4% |
Demographics Similar to Yaqui by Professional Degree
In terms of professional degree, the demographic groups most similar to Yaqui are Crow (3.2%, a difference of 0.060%), Inupiat (3.2%, a difference of 0.34%), Hispanic or Latino (3.2%, a difference of 0.42%), Tsimshian (3.2%, a difference of 0.78%), and Seminole (3.2%, a difference of 1.1%).
| Demographics | Rating | Rank | Professional Degree |
| Immigrants | Micronesia | 0.1 /100 | #318 | Tragic 3.2% |
| Choctaw | 0.1 /100 | #319 | Tragic 3.2% |
| Seminole | 0.1 /100 | #320 | Tragic 3.2% |
| Tsimshian | 0.0 /100 | #321 | Tragic 3.2% |
| Hispanics or Latinos | 0.0 /100 | #322 | Tragic 3.2% |
| Inupiat | 0.0 /100 | #323 | Tragic 3.2% |
| Crow | 0.0 /100 | #324 | Tragic 3.2% |
| Yaqui | 0.0 /100 | #325 | Tragic 3.2% |
| Menominee | 0.0 /100 | #326 | Tragic 3.1% |
| Dutch West Indians | 0.0 /100 | #327 | Tragic 3.1% |
| Creek | 0.0 /100 | #328 | Tragic 3.1% |
| Bangladeshis | 0.0 /100 | #329 | Tragic 3.1% |
| Immigrants | Cabo Verde | 0.0 /100 | #330 | Tragic 3.1% |
| Kiowa | 0.0 /100 | #331 | Tragic 3.1% |
| Yakama | 0.0 /100 | #332 | Tragic 3.1% |