Immigrants from Colombia vs Yaqui Master's Degree
COMPARE
Immigrants from Colombia
Yaqui
Master's Degree
Master's Degree Comparison
Immigrants from Colombia
Yaqui
14.9%
MASTER'S DEGREE
48.3/ 100
METRIC RATING
177th/ 347
METRIC RANK
11.0%
MASTER'S DEGREE
0.0/ 100
METRIC RATING
313th/ 347
METRIC RANK
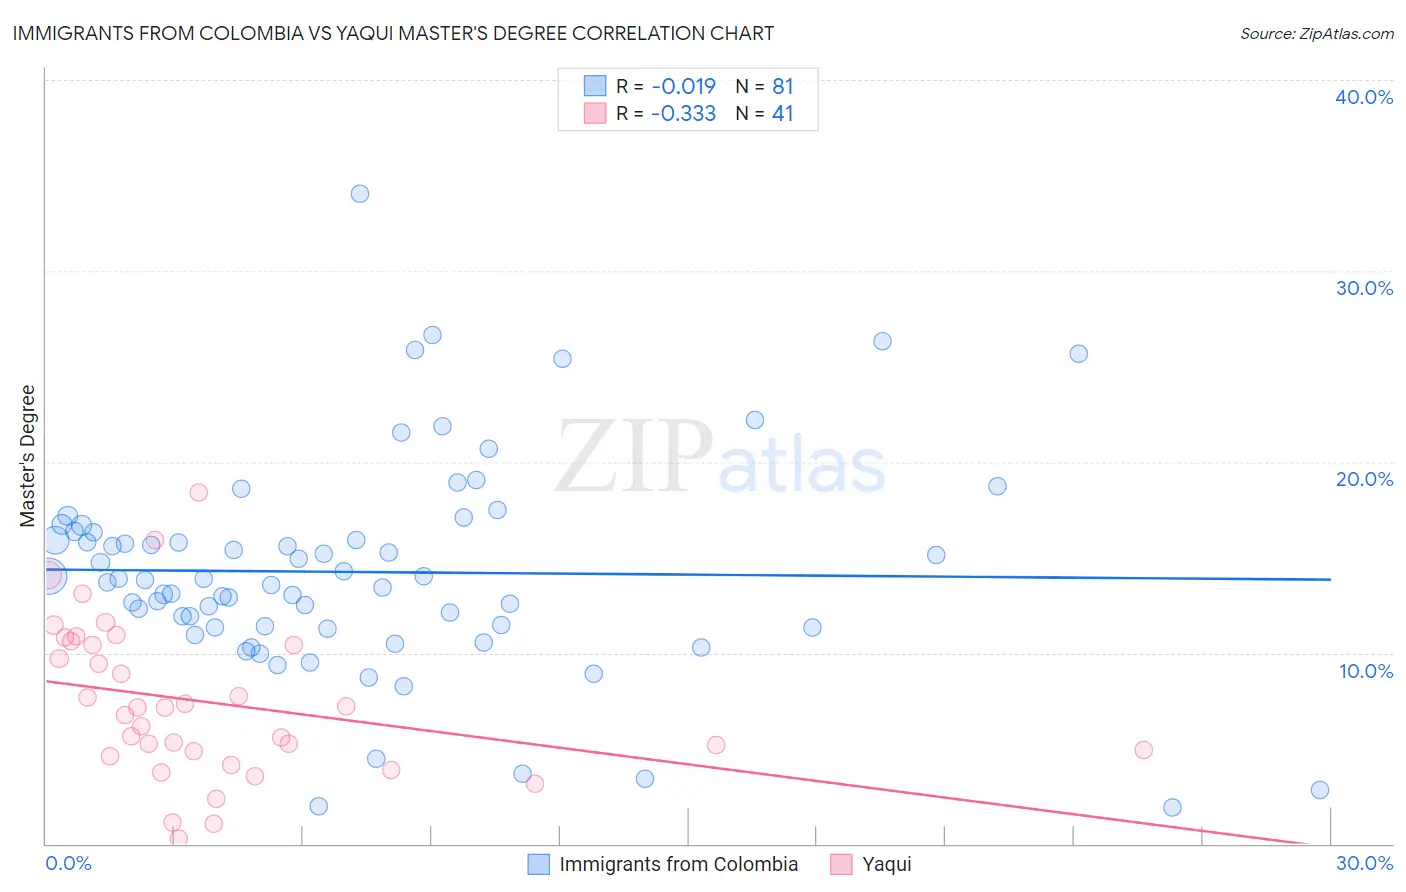
Immigrants from Colombia vs Yaqui Master's Degree Correlation Chart
The statistical analysis conducted on geographies consisting of 378,578,411 people shows no correlation between the proportion of Immigrants from Colombia and percentage of population with at least master's degree education in the United States with a correlation coefficient (R) of -0.019 and weighted average of 14.9%. Similarly, the statistical analysis conducted on geographies consisting of 107,722,920 people shows a mild negative correlation between the proportion of Yaqui and percentage of population with at least master's degree education in the United States with a correlation coefficient (R) of -0.333 and weighted average of 11.0%, a difference of 35.2%.
Master's Degree Correlation Summary
| Measurement | Immigrants from Colombia | Yaqui |
| Minimum | 1.9% | 0.29% |
| Maximum | 34.0% | 18.4% |
| Range | 32.1% | 18.1% |
| Mean | 14.2% | 7.4% |
| Median | 13.8% | 7.1% |
| Interquartile 25% (IQ1) | 11.3% | 4.7% |
| Interquartile 75% (IQ3) | 16.3% | 10.5% |
| Interquartile Range (IQR) | 5.0% | 5.8% |
| Standard Deviation (Sample) | 5.6% | 4.0% |
| Standard Deviation (Population) | 5.6% | 4.0% |
Similar Demographics by Master's Degree
Demographics Similar to Immigrants from Colombia by Master's Degree
In terms of master's degree, the demographic groups most similar to Immigrants from Colombia are Nigerian (14.9%, a difference of 0.030%), Immigrants from Peru (14.9%, a difference of 0.17%), Slovak (14.9%, a difference of 0.21%), English (14.8%, a difference of 0.44%), and Costa Rican (15.0%, a difference of 0.53%).
| Demographics | Rating | Rank | Master's Degree |
| Irish | 56.3 /100 | #170 | Average 15.0% |
| Immigrants | Ghana | 53.6 /100 | #171 | Average 15.0% |
| Immigrants | Uruguay | 52.8 /100 | #172 | Average 15.0% |
| Costa Ricans | 52.5 /100 | #173 | Average 15.0% |
| Slovaks | 50.0 /100 | #174 | Average 14.9% |
| Immigrants | Peru | 49.6 /100 | #175 | Average 14.9% |
| Nigerians | 48.6 /100 | #176 | Average 14.9% |
| Immigrants | Colombia | 48.3 /100 | #177 | Average 14.9% |
| English | 45.0 /100 | #178 | Average 14.8% |
| Immigrants | Iraq | 41.3 /100 | #179 | Average 14.8% |
| Celtics | 41.3 /100 | #180 | Average 14.8% |
| Swiss | 41.1 /100 | #181 | Average 14.7% |
| Czechs | 40.4 /100 | #182 | Average 14.7% |
| Sri Lankans | 39.6 /100 | #183 | Fair 14.7% |
| Immigrants | Zaire | 39.5 /100 | #184 | Fair 14.7% |
Demographics Similar to Yaqui by Master's Degree
In terms of master's degree, the demographic groups most similar to Yaqui are Choctaw (11.0%, a difference of 0.18%), Seminole (11.0%, a difference of 0.27%), Cajun (11.0%, a difference of 0.40%), Apache (11.0%, a difference of 0.40%), and Hispanic or Latino (10.9%, a difference of 0.74%).
| Demographics | Rating | Rank | Master's Degree |
| Mexican American Indians | 0.0 /100 | #306 | Tragic 11.2% |
| Cheyenne | 0.0 /100 | #307 | Tragic 11.2% |
| Puerto Ricans | 0.0 /100 | #308 | Tragic 11.2% |
| Puget Sound Salish | 0.0 /100 | #309 | Tragic 11.1% |
| Shoshone | 0.0 /100 | #310 | Tragic 11.1% |
| Seminole | 0.0 /100 | #311 | Tragic 11.0% |
| Choctaw | 0.0 /100 | #312 | Tragic 11.0% |
| Yaqui | 0.0 /100 | #313 | Tragic 11.0% |
| Cajuns | 0.0 /100 | #314 | Tragic 11.0% |
| Apache | 0.0 /100 | #315 | Tragic 11.0% |
| Hispanics or Latinos | 0.0 /100 | #316 | Tragic 10.9% |
| Hopi | 0.0 /100 | #317 | Tragic 10.9% |
| Immigrants | Cuba | 0.0 /100 | #318 | Tragic 10.9% |
| Kiowa | 0.0 /100 | #319 | Tragic 10.8% |
| Immigrants | Micronesia | 0.0 /100 | #320 | Tragic 10.8% |