Immigrants from Chile vs Immigrants from Haiti 4th Grade
COMPARE
Immigrants from Chile
Immigrants from Haiti
4th Grade
4th Grade Comparison
Immigrants from Chile
Immigrants from Haiti
97.4%
4TH GRADE
16.1/ 100
METRIC RATING
202nd/ 347
METRIC RANK
96.3%
4TH GRADE
0.0/ 100
METRIC RATING
307th/ 347
METRIC RANK
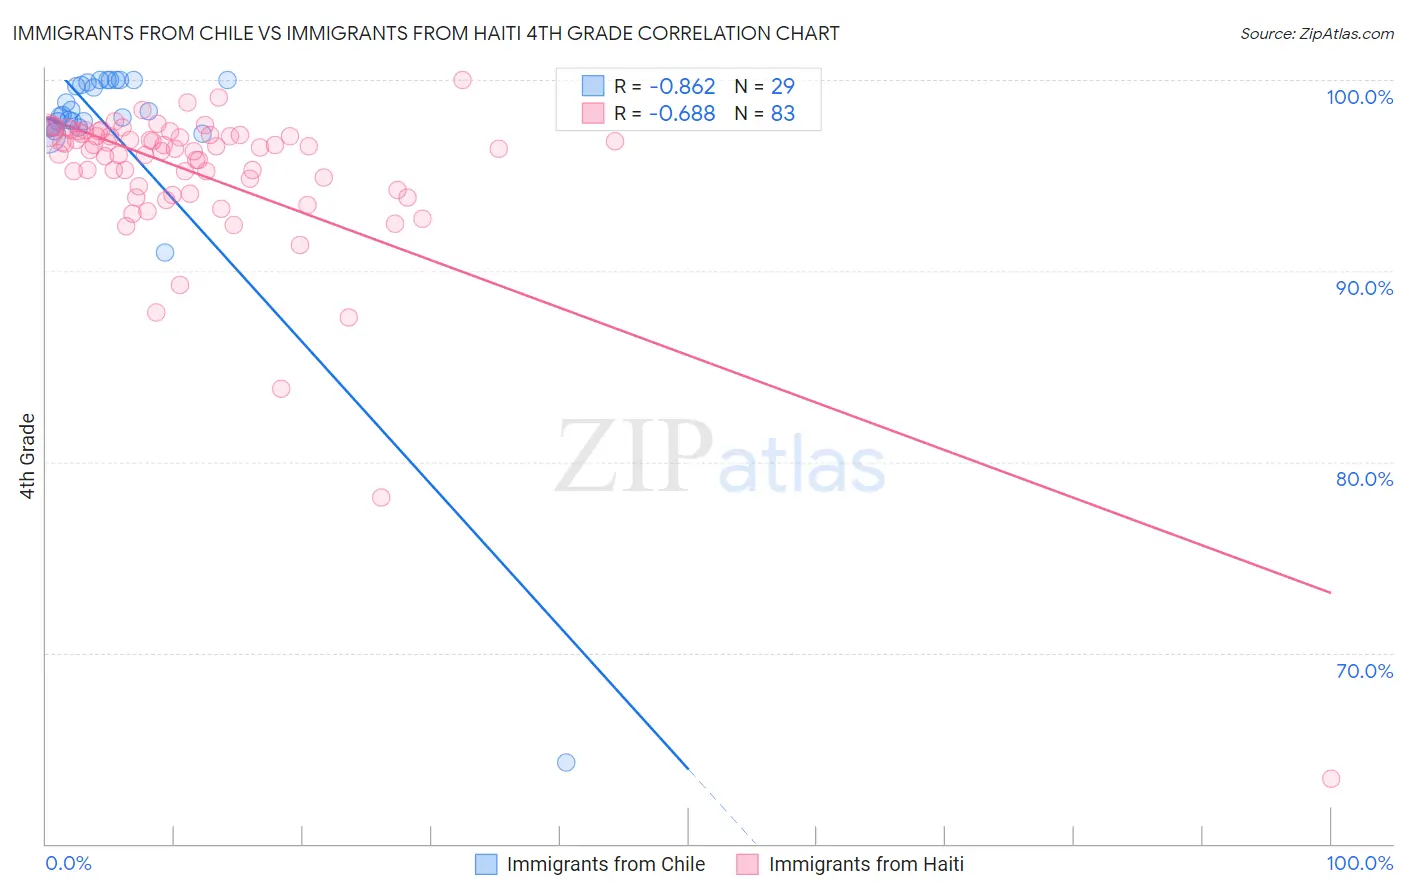
Immigrants from Chile vs Immigrants from Haiti 4th Grade Correlation Chart
The statistical analysis conducted on geographies consisting of 218,647,266 people shows a very strong negative correlation between the proportion of Immigrants from Chile and percentage of population with at least 4th grade education in the United States with a correlation coefficient (R) of -0.862 and weighted average of 97.4%. Similarly, the statistical analysis conducted on geographies consisting of 225,286,718 people shows a significant negative correlation between the proportion of Immigrants from Haiti and percentage of population with at least 4th grade education in the United States with a correlation coefficient (R) of -0.688 and weighted average of 96.3%, a difference of 1.1%.
4th Grade Correlation Summary
| Measurement | Immigrants from Chile | Immigrants from Haiti |
| Minimum | 64.3% | 63.4% |
| Maximum | 100.0% | 100.0% |
| Range | 35.7% | 36.6% |
| Mean | 97.2% | 95.0% |
| Median | 98.1% | 96.4% |
| Interquartile 25% (IQ1) | 97.5% | 94.2% |
| Interquartile 75% (IQ3) | 99.9% | 97.1% |
| Interquartile Range (IQR) | 2.4% | 2.9% |
| Standard Deviation (Sample) | 6.6% | 4.8% |
| Standard Deviation (Population) | 6.5% | 4.7% |
Similar Demographics by 4th Grade
Demographics Similar to Immigrants from Chile by 4th Grade
In terms of 4th grade, the demographic groups most similar to Immigrants from Chile are Immigrants from Southern Europe (97.4%, a difference of 0.0%), Immigrants from Northern Africa (97.4%, a difference of 0.010%), African (97.4%, a difference of 0.010%), Immigrants from Uganda (97.4%, a difference of 0.020%), and Paiute (97.3%, a difference of 0.020%).
| Demographics | Rating | Rank | 4th Grade |
| Paraguayans | 28.9 /100 | #195 | Fair 97.4% |
| Immigrants | Albania | 27.7 /100 | #196 | Fair 97.4% |
| Hawaiians | 25.6 /100 | #197 | Fair 97.4% |
| Guamanians/Chamorros | 23.0 /100 | #198 | Fair 97.4% |
| Natives/Alaskans | 20.6 /100 | #199 | Fair 97.4% |
| Immigrants | Uganda | 19.8 /100 | #200 | Poor 97.4% |
| Immigrants | Southern Europe | 16.2 /100 | #201 | Poor 97.4% |
| Immigrants | Chile | 16.1 /100 | #202 | Poor 97.4% |
| Immigrants | Northern Africa | 15.1 /100 | #203 | Poor 97.4% |
| Africans | 14.6 /100 | #204 | Poor 97.4% |
| Paiute | 13.2 /100 | #205 | Poor 97.3% |
| Immigrants | Zaire | 12.8 /100 | #206 | Poor 97.3% |
| Moroccans | 11.3 /100 | #207 | Poor 97.3% |
| Immigrants | Bahamas | 10.8 /100 | #208 | Poor 97.3% |
| Laotians | 9.3 /100 | #209 | Tragic 97.3% |
Demographics Similar to Immigrants from Haiti by 4th Grade
In terms of 4th grade, the demographic groups most similar to Immigrants from Haiti are Immigrants from Laos (96.3%, a difference of 0.010%), Immigrants from Guyana (96.3%, a difference of 0.010%), Sri Lankan (96.4%, a difference of 0.030%), Immigrants from Caribbean (96.4%, a difference of 0.040%), and Immigrants from Burma/Myanmar (96.3%, a difference of 0.040%).
| Demographics | Rating | Rank | 4th Grade |
| Immigrants | South Eastern Asia | 0.0 /100 | #300 | Tragic 96.5% |
| Immigrants | Immigrants | 0.0 /100 | #301 | Tragic 96.5% |
| Immigrants | Cuba | 0.0 /100 | #302 | Tragic 96.4% |
| Guyanese | 0.0 /100 | #303 | Tragic 96.4% |
| Ecuadorians | 0.0 /100 | #304 | Tragic 96.4% |
| Immigrants | Caribbean | 0.0 /100 | #305 | Tragic 96.4% |
| Sri Lankans | 0.0 /100 | #306 | Tragic 96.4% |
| Immigrants | Haiti | 0.0 /100 | #307 | Tragic 96.3% |
| Immigrants | Laos | 0.0 /100 | #308 | Tragic 96.3% |
| Immigrants | Guyana | 0.0 /100 | #309 | Tragic 96.3% |
| Immigrants | Burma/Myanmar | 0.0 /100 | #310 | Tragic 96.3% |
| Immigrants | Bangladesh | 0.0 /100 | #311 | Tragic 96.2% |
| Cape Verdeans | 0.0 /100 | #312 | Tragic 96.2% |
| Indonesians | 0.0 /100 | #313 | Tragic 96.2% |
| Vietnamese | 0.0 /100 | #314 | Tragic 96.2% |