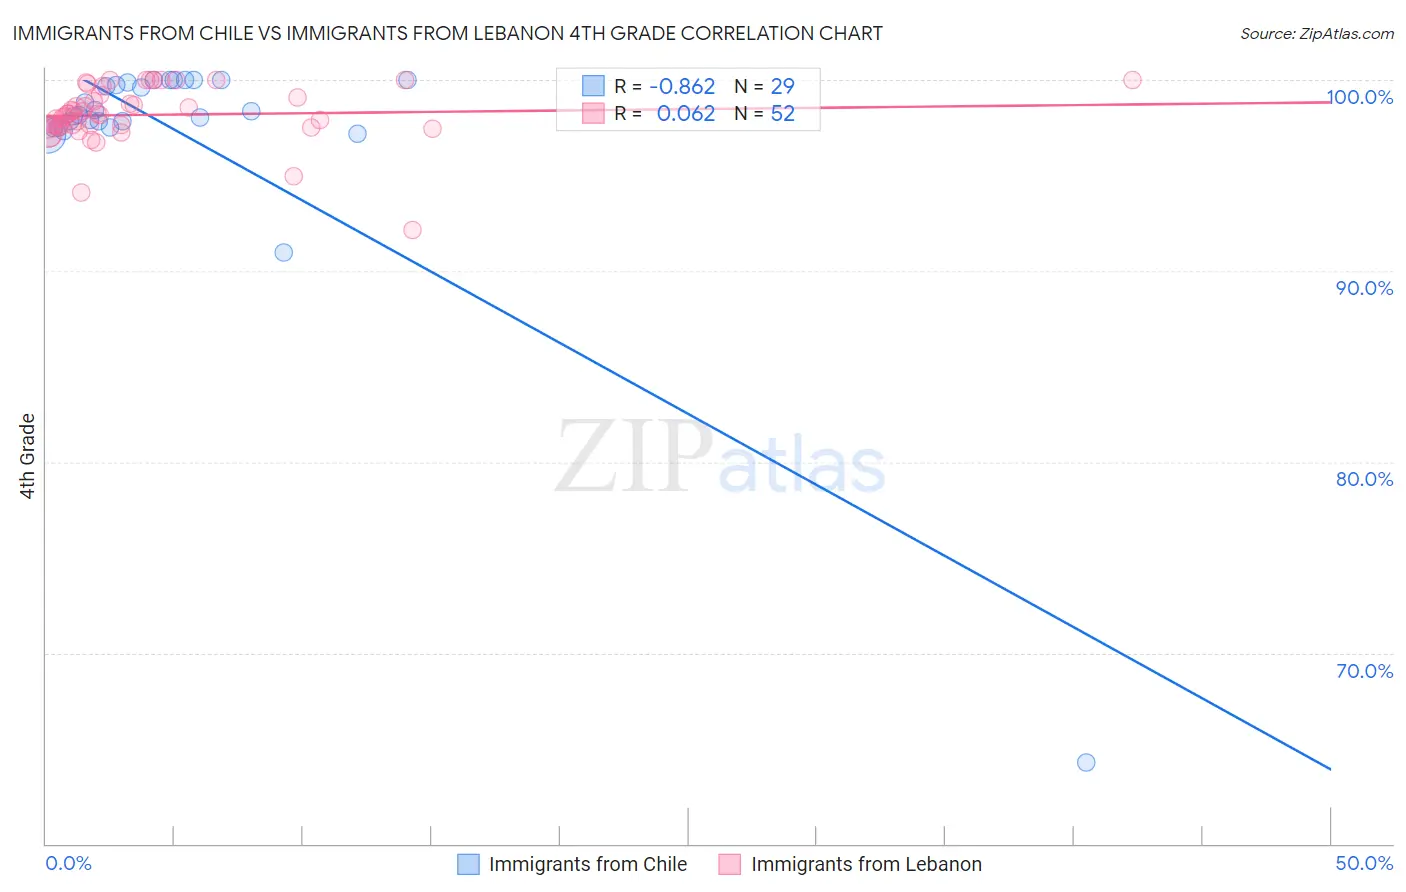
Immigrants from Chile vs Immigrants from Lebanon 4th Grade
COMPARE
Immigrants from Chile
Immigrants from Lebanon
4th Grade
4th Grade Comparison
Immigrants from Chile
Immigrants from Lebanon
97.4%
4TH GRADE
16.1/ 100
METRIC RATING
202nd/ 347
METRIC RANK
97.3%
4TH GRADE
5.1/ 100
METRIC RATING
222nd/ 347
METRIC RANK
Immigrants from Chile vs Immigrants from Lebanon 4th Grade Correlation Chart
The statistical analysis conducted on geographies consisting of 218,647,266 people shows a very strong negative correlation between the proportion of Immigrants from Chile and percentage of population with at least 4th grade education in the United States with a correlation coefficient (R) of -0.862 and weighted average of 97.4%. Similarly, the statistical analysis conducted on geographies consisting of 217,155,328 people shows a slight positive correlation between the proportion of Immigrants from Lebanon and percentage of population with at least 4th grade education in the United States with a correlation coefficient (R) of 0.062 and weighted average of 97.3%, a difference of 0.12%.
4th Grade Correlation Summary
| Measurement | Immigrants from Chile | Immigrants from Lebanon |
| Minimum | 64.3% | 92.2% |
| Maximum | 100.0% | 100.0% |
| Range | 35.7% | 7.8% |
| Mean | 97.2% | 98.2% |
| Median | 98.1% | 98.2% |
| Interquartile 25% (IQ1) | 97.5% | 97.6% |
| Interquartile 75% (IQ3) | 99.9% | 99.2% |
| Interquartile Range (IQR) | 2.4% | 1.6% |
| Standard Deviation (Sample) | 6.6% | 1.5% |
| Standard Deviation (Population) | 6.5% | 1.5% |
Demographics Similar to Immigrants from Chile and Immigrants from Lebanon by 4th Grade
In terms of 4th grade, the demographic groups most similar to Immigrants from Chile are Immigrants from Northern Africa (97.4%, a difference of 0.010%), African (97.4%, a difference of 0.010%), Paiute (97.3%, a difference of 0.020%), Immigrants from Zaire (97.3%, a difference of 0.030%), and Moroccan (97.3%, a difference of 0.040%). Similarly, the demographic groups most similar to Immigrants from Lebanon are Tongan (97.3%, a difference of 0.010%), South American Indian (97.3%, a difference of 0.010%), Immigrants from Panama (97.3%, a difference of 0.010%), Sierra Leonean (97.3%, a difference of 0.020%), and Iraqi (97.3%, a difference of 0.020%).
| Demographics | Rating | Rank | 4th Grade |
| Immigrants | Chile | 16.1 /100 | #202 | Poor 97.4% |
| Immigrants | Northern Africa | 15.1 /100 | #203 | Poor 97.4% |
| Africans | 14.6 /100 | #204 | Poor 97.4% |
| Paiute | 13.2 /100 | #205 | Poor 97.3% |
| Immigrants | Zaire | 12.8 /100 | #206 | Poor 97.3% |
| Moroccans | 11.3 /100 | #207 | Poor 97.3% |
| Immigrants | Bahamas | 10.8 /100 | #208 | Poor 97.3% |
| Laotians | 9.3 /100 | #209 | Tragic 97.3% |
| Immigrants | Oceania | 9.1 /100 | #210 | Tragic 97.3% |
| Sudanese | 9.0 /100 | #211 | Tragic 97.3% |
| Tohono O'odham | 8.4 /100 | #212 | Tragic 97.3% |
| Costa Ricans | 8.3 /100 | #213 | Tragic 97.3% |
| Immigrants | Nepal | 7.7 /100 | #214 | Tragic 97.3% |
| Immigrants | Morocco | 7.1 /100 | #215 | Tragic 97.3% |
| Samoans | 6.8 /100 | #216 | Tragic 97.3% |
| Sierra Leoneans | 6.5 /100 | #217 | Tragic 97.3% |
| Iraqis | 6.3 /100 | #218 | Tragic 97.3% |
| Tongans | 5.8 /100 | #219 | Tragic 97.3% |
| South American Indians | 5.5 /100 | #220 | Tragic 97.3% |
| Immigrants | Panama | 5.4 /100 | #221 | Tragic 97.3% |
| Immigrants | Lebanon | 5.1 /100 | #222 | Tragic 97.3% |