Immigrants from Central America vs Sudanese Nursery School
COMPARE
Immigrants from Central America
Sudanese
Nursery School
Nursery School Comparison
Immigrants from Central America
Sudanese
96.4%
NURSERY SCHOOL
0.0/ 100
METRIC RATING
340th/ 347
METRIC RANK
97.7%
NURSERY SCHOOL
3.2/ 100
METRIC RATING
228th/ 347
METRIC RANK
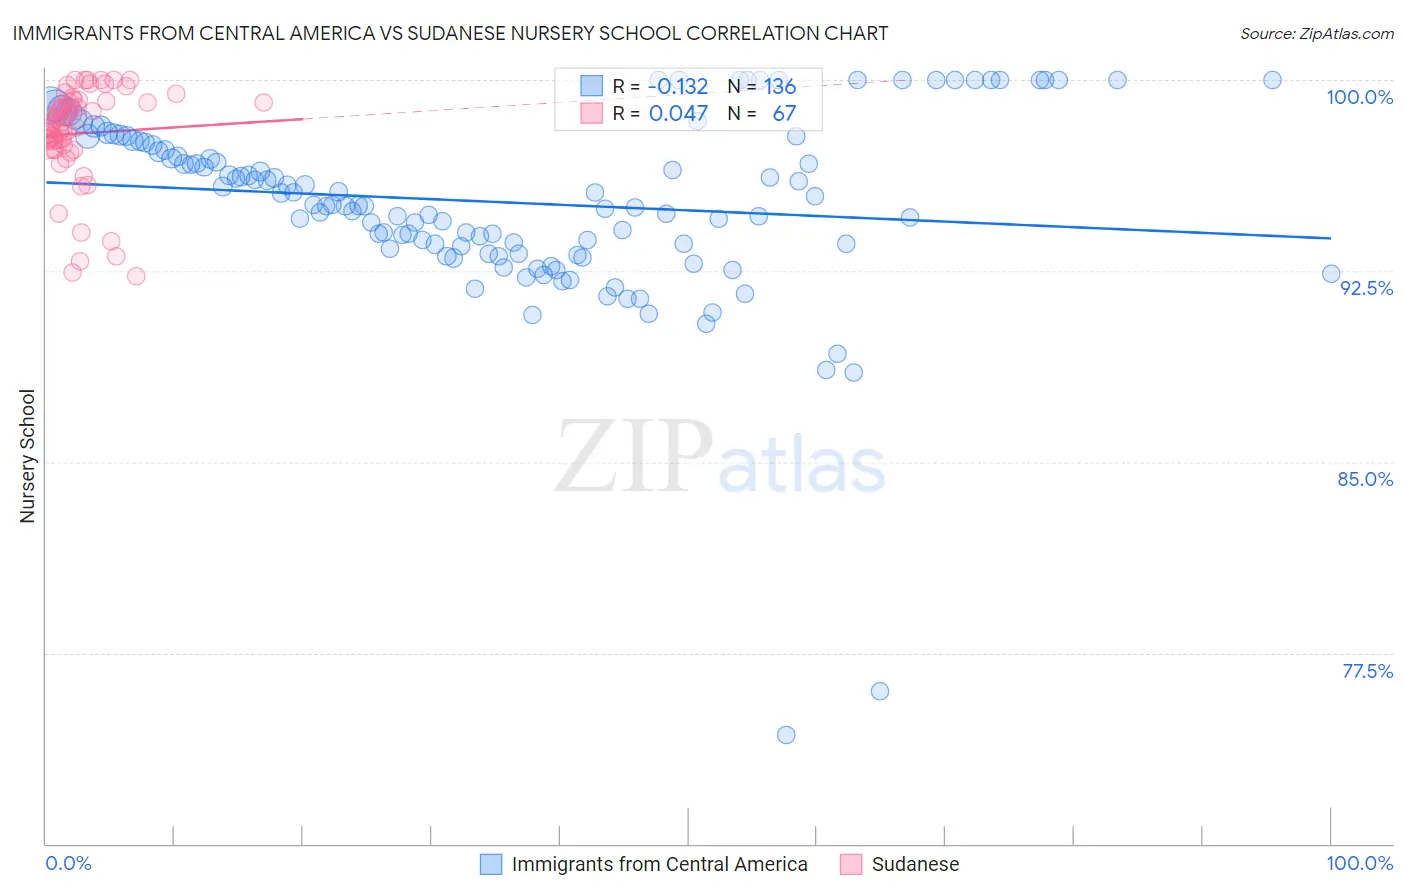
Immigrants from Central America vs Sudanese Nursery School Correlation Chart
The statistical analysis conducted on geographies consisting of 536,554,221 people shows a poor negative correlation between the proportion of Immigrants from Central America and percentage of population with at least nursery school education in the United States with a correlation coefficient (R) of -0.132 and weighted average of 96.4%. Similarly, the statistical analysis conducted on geographies consisting of 110,145,984 people shows no correlation between the proportion of Sudanese and percentage of population with at least nursery school education in the United States with a correlation coefficient (R) of 0.047 and weighted average of 97.7%, a difference of 1.4%.
Nursery School Correlation Summary
| Measurement | Immigrants from Central America | Sudanese |
| Minimum | 74.3% | 92.3% |
| Maximum | 100.0% | 100.0% |
| Range | 25.7% | 7.7% |
| Mean | 95.2% | 97.9% |
| Median | 95.1% | 98.3% |
| Interquartile 25% (IQ1) | 93.4% | 97.5% |
| Interquartile 75% (IQ3) | 97.6% | 99.1% |
| Interquartile Range (IQR) | 4.2% | 1.7% |
| Standard Deviation (Sample) | 3.7% | 1.9% |
| Standard Deviation (Population) | 3.7% | 1.9% |
Similar Demographics by Nursery School
Demographics Similar to Immigrants from Central America by Nursery School
In terms of nursery school, the demographic groups most similar to Immigrants from Central America are Immigrants from Cabo Verde (96.4%, a difference of 0.020%), Immigrants from Guatemala (96.4%, a difference of 0.030%), Immigrants from Mexico (96.4%, a difference of 0.030%), Salvadoran (96.4%, a difference of 0.060%), and Immigrants from Cambodia (96.5%, a difference of 0.11%).
| Demographics | Rating | Rank | Nursery School |
| Central Americans | 0.0 /100 | #333 | Tragic 96.6% |
| Immigrants | Dominican Republic | 0.0 /100 | #334 | Tragic 96.6% |
| Bangladeshis | 0.0 /100 | #335 | Tragic 96.6% |
| Guatemalans | 0.0 /100 | #336 | Tragic 96.6% |
| Immigrants | Cambodia | 0.0 /100 | #337 | Tragic 96.5% |
| Immigrants | Fiji | 0.0 /100 | #338 | Tragic 96.5% |
| Immigrants | Guatemala | 0.0 /100 | #339 | Tragic 96.4% |
| Immigrants | Central America | 0.0 /100 | #340 | Tragic 96.4% |
| Immigrants | Cabo Verde | 0.0 /100 | #341 | Tragic 96.4% |
| Immigrants | Mexico | 0.0 /100 | #342 | Tragic 96.4% |
| Salvadorans | 0.0 /100 | #343 | Tragic 96.4% |
| Immigrants | El Salvador | 0.0 /100 | #344 | Tragic 96.2% |
| Nepalese | 0.0 /100 | #345 | Tragic 96.2% |
| Immigrants | Yemen | 0.0 /100 | #346 | Tragic 95.9% |
| Spanish American Indians | 0.0 /100 | #347 | Tragic 95.8% |
Demographics Similar to Sudanese by Nursery School
In terms of nursery school, the demographic groups most similar to Sudanese are Subsaharan African (97.7%, a difference of 0.0%), Senegalese (97.7%, a difference of 0.0%), Immigrants from Nepal (97.7%, a difference of 0.010%), Immigrants from Costa Rica (97.7%, a difference of 0.010%), and Iraqi (97.7%, a difference of 0.010%).
| Demographics | Rating | Rank | Nursery School |
| Tongans | 4.3 /100 | #221 | Tragic 97.8% |
| Immigrants | Syria | 4.0 /100 | #222 | Tragic 97.7% |
| Immigrants | Sudan | 3.9 /100 | #223 | Tragic 97.7% |
| Immigrants | Nepal | 3.6 /100 | #224 | Tragic 97.7% |
| Immigrants | Costa Rica | 3.5 /100 | #225 | Tragic 97.7% |
| Iraqis | 3.5 /100 | #226 | Tragic 97.7% |
| Sub-Saharan Africans | 3.2 /100 | #227 | Tragic 97.7% |
| Sudanese | 3.2 /100 | #228 | Tragic 97.7% |
| Senegalese | 3.2 /100 | #229 | Tragic 97.7% |
| Sierra Leoneans | 2.9 /100 | #230 | Tragic 97.7% |
| Puerto Ricans | 2.6 /100 | #231 | Tragic 97.7% |
| Immigrants | Uruguay | 2.3 /100 | #232 | Tragic 97.7% |
| U.S. Virgin Islanders | 2.1 /100 | #233 | Tragic 97.7% |
| Colombians | 2.1 /100 | #234 | Tragic 97.7% |
| Immigrants | Pakistan | 2.1 /100 | #235 | Tragic 97.7% |