Immigrants from Central America vs Burmese Nursery School
COMPARE
Immigrants from Central America
Burmese
Nursery School
Nursery School Comparison
Immigrants from Central America
Burmese
96.4%
NURSERY SCHOOL
0.0/ 100
METRIC RATING
340th/ 347
METRIC RANK
98.1%
NURSERY SCHOOL
81.7/ 100
METRIC RATING
142nd/ 347
METRIC RANK
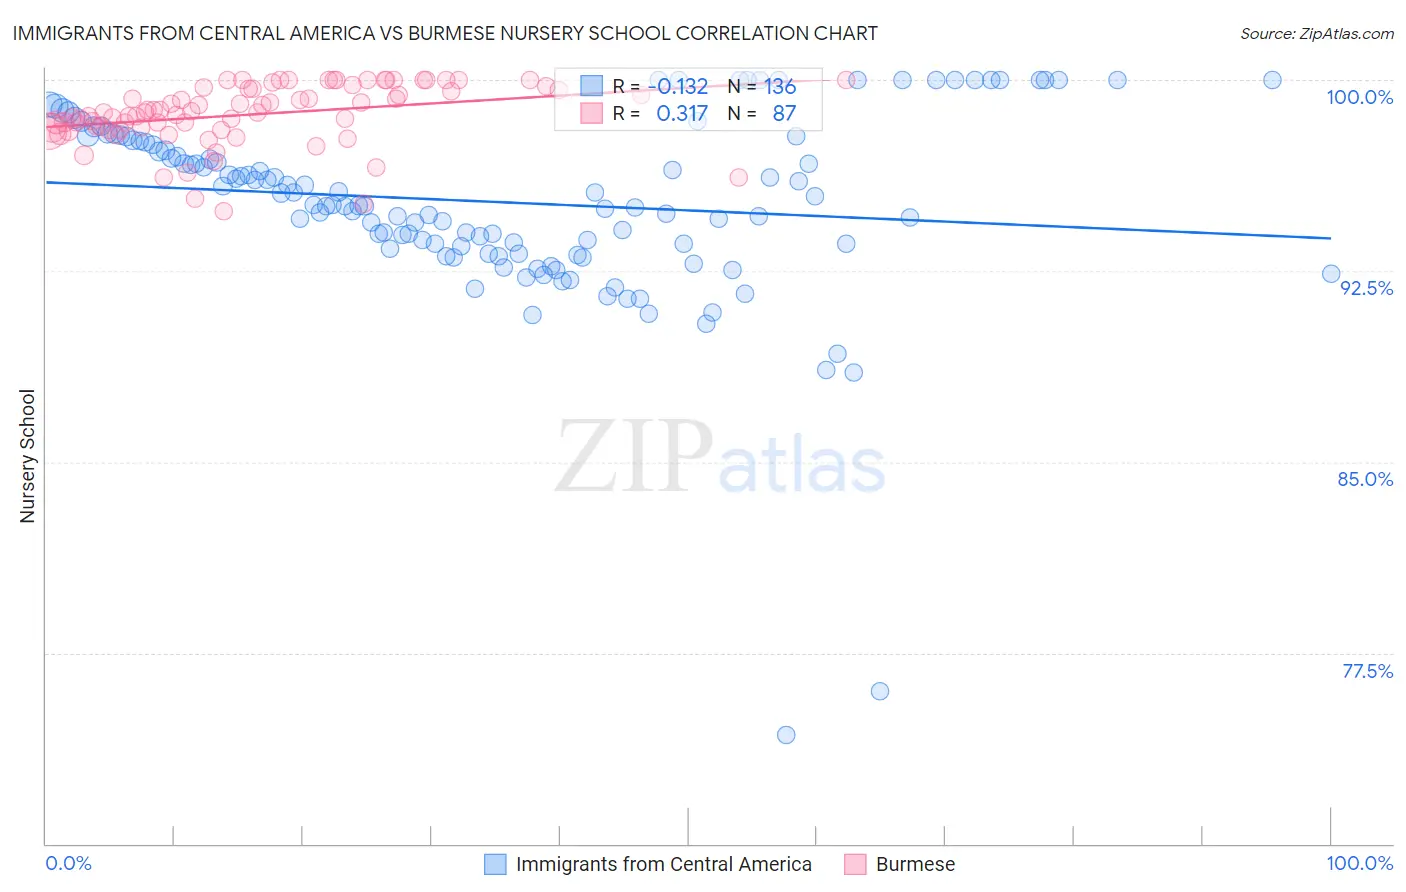
Immigrants from Central America vs Burmese Nursery School Correlation Chart
The statistical analysis conducted on geographies consisting of 536,554,221 people shows a poor negative correlation between the proportion of Immigrants from Central America and percentage of population with at least nursery school education in the United States with a correlation coefficient (R) of -0.132 and weighted average of 96.4%. Similarly, the statistical analysis conducted on geographies consisting of 465,408,311 people shows a mild positive correlation between the proportion of Burmese and percentage of population with at least nursery school education in the United States with a correlation coefficient (R) of 0.317 and weighted average of 98.1%, a difference of 1.7%.
Nursery School Correlation Summary
| Measurement | Immigrants from Central America | Burmese |
| Minimum | 74.3% | 94.9% |
| Maximum | 100.0% | 100.0% |
| Range | 25.7% | 5.1% |
| Mean | 95.2% | 98.6% |
| Median | 95.1% | 98.7% |
| Interquartile 25% (IQ1) | 93.4% | 98.0% |
| Interquartile 75% (IQ3) | 97.6% | 99.7% |
| Interquartile Range (IQR) | 4.2% | 1.6% |
| Standard Deviation (Sample) | 3.7% | 1.2% |
| Standard Deviation (Population) | 3.7% | 1.2% |
Similar Demographics by Nursery School
Demographics Similar to Immigrants from Central America by Nursery School
In terms of nursery school, the demographic groups most similar to Immigrants from Central America are Immigrants from Cabo Verde (96.4%, a difference of 0.020%), Immigrants from Guatemala (96.4%, a difference of 0.030%), Immigrants from Mexico (96.4%, a difference of 0.030%), Salvadoran (96.4%, a difference of 0.060%), and Immigrants from Cambodia (96.5%, a difference of 0.11%).
| Demographics | Rating | Rank | Nursery School |
| Central Americans | 0.0 /100 | #333 | Tragic 96.6% |
| Immigrants | Dominican Republic | 0.0 /100 | #334 | Tragic 96.6% |
| Bangladeshis | 0.0 /100 | #335 | Tragic 96.6% |
| Guatemalans | 0.0 /100 | #336 | Tragic 96.6% |
| Immigrants | Cambodia | 0.0 /100 | #337 | Tragic 96.5% |
| Immigrants | Fiji | 0.0 /100 | #338 | Tragic 96.5% |
| Immigrants | Guatemala | 0.0 /100 | #339 | Tragic 96.4% |
| Immigrants | Central America | 0.0 /100 | #340 | Tragic 96.4% |
| Immigrants | Cabo Verde | 0.0 /100 | #341 | Tragic 96.4% |
| Immigrants | Mexico | 0.0 /100 | #342 | Tragic 96.4% |
| Salvadorans | 0.0 /100 | #343 | Tragic 96.4% |
| Immigrants | El Salvador | 0.0 /100 | #344 | Tragic 96.2% |
| Nepalese | 0.0 /100 | #345 | Tragic 96.2% |
| Immigrants | Yemen | 0.0 /100 | #346 | Tragic 95.9% |
| Spanish American Indians | 0.0 /100 | #347 | Tragic 95.8% |
Demographics Similar to Burmese by Nursery School
In terms of nursery school, the demographic groups most similar to Burmese are Marshallese (98.1%, a difference of 0.0%), Palestinian (98.1%, a difference of 0.010%), Immigrants from Turkey (98.1%, a difference of 0.010%), Alsatian (98.1%, a difference of 0.010%), and Immigrants from Israel (98.1%, a difference of 0.010%).
| Demographics | Rating | Rank | Nursery School |
| Immigrants | Hungary | 89.3 /100 | #135 | Excellent 98.1% |
| Immigrants | Kuwait | 88.9 /100 | #136 | Excellent 98.1% |
| Israelis | 88.2 /100 | #137 | Excellent 98.1% |
| Immigrants | Romania | 88.0 /100 | #138 | Excellent 98.1% |
| Blackfeet | 87.5 /100 | #139 | Excellent 98.1% |
| Palestinians | 83.7 /100 | #140 | Excellent 98.1% |
| Immigrants | Turkey | 83.0 /100 | #141 | Excellent 98.1% |
| Burmese | 81.7 /100 | #142 | Excellent 98.1% |
| Marshallese | 81.2 /100 | #143 | Excellent 98.1% |
| Alsatians | 80.3 /100 | #144 | Excellent 98.1% |
| Immigrants | Israel | 78.5 /100 | #145 | Good 98.1% |
| Filipinos | 78.5 /100 | #146 | Good 98.1% |
| Hmong | 75.7 /100 | #147 | Good 98.1% |
| Immigrants | Greece | 75.4 /100 | #148 | Good 98.1% |
| Apache | 73.2 /100 | #149 | Good 98.1% |