Immigrants from Central America vs Immigrants from Lebanon Nursery School
COMPARE
Immigrants from Central America
Immigrants from Lebanon
Nursery School
Nursery School Comparison
Immigrants from Central America
Immigrants from Lebanon
96.4%
NURSERY SCHOOL
0.0/ 100
METRIC RATING
340th/ 347
METRIC RANK
97.9%
NURSERY SCHOOL
21.2/ 100
METRIC RATING
201st/ 347
METRIC RANK
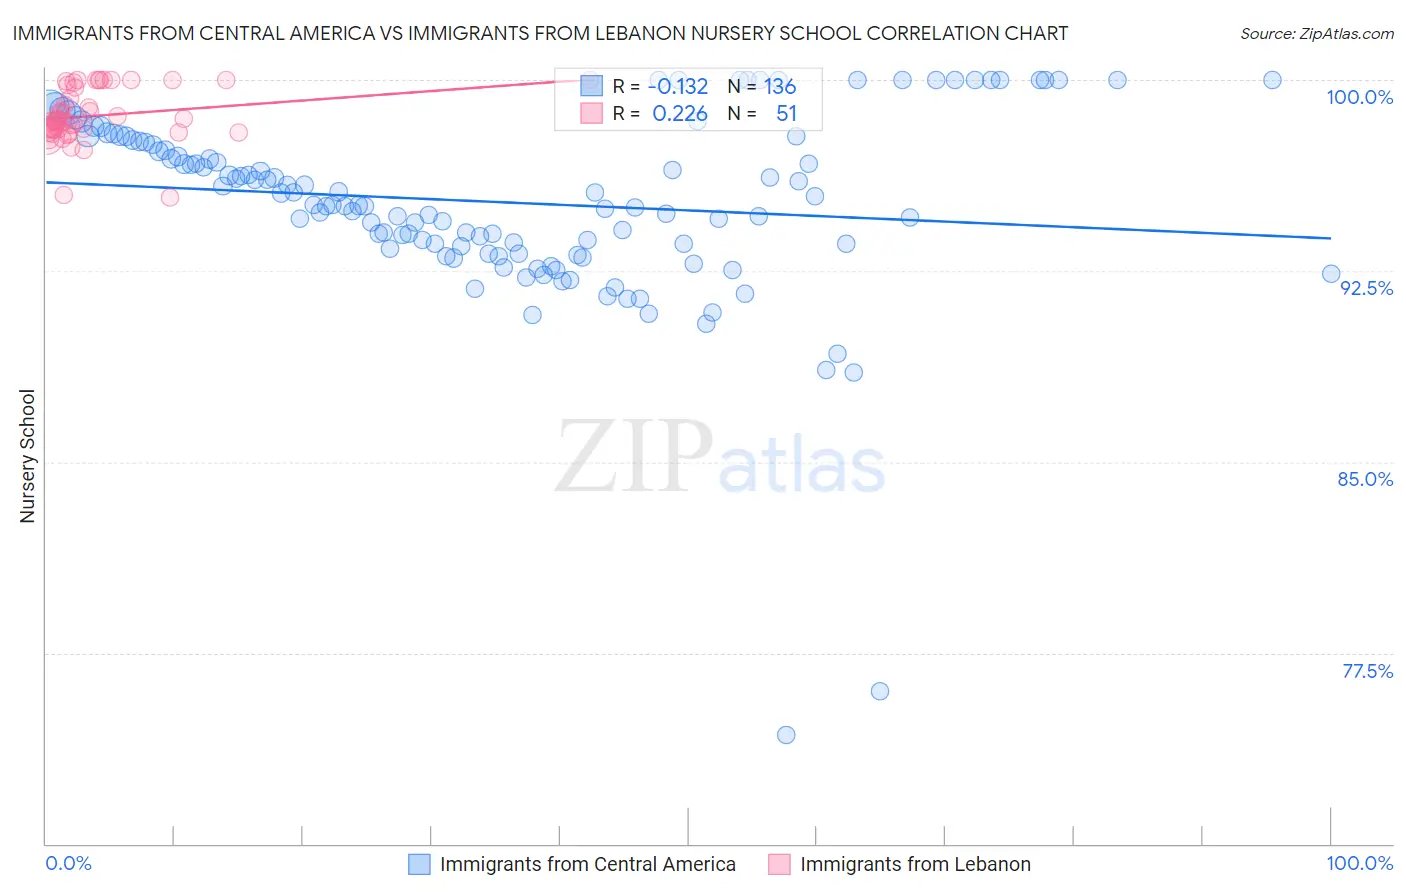
Immigrants from Central America vs Immigrants from Lebanon Nursery School Correlation Chart
The statistical analysis conducted on geographies consisting of 536,554,221 people shows a poor negative correlation between the proportion of Immigrants from Central America and percentage of population with at least nursery school education in the United States with a correlation coefficient (R) of -0.132 and weighted average of 96.4%. Similarly, the statistical analysis conducted on geographies consisting of 217,102,284 people shows a weak positive correlation between the proportion of Immigrants from Lebanon and percentage of population with at least nursery school education in the United States with a correlation coefficient (R) of 0.226 and weighted average of 97.9%, a difference of 1.5%.
Nursery School Correlation Summary
| Measurement | Immigrants from Central America | Immigrants from Lebanon |
| Minimum | 74.3% | 95.4% |
| Maximum | 100.0% | 100.0% |
| Range | 25.7% | 4.6% |
| Mean | 95.2% | 98.6% |
| Median | 95.1% | 98.4% |
| Interquartile 25% (IQ1) | 93.4% | 98.0% |
| Interquartile 75% (IQ3) | 97.6% | 99.8% |
| Interquartile Range (IQR) | 4.2% | 1.8% |
| Standard Deviation (Sample) | 3.7% | 1.1% |
| Standard Deviation (Population) | 3.7% | 1.1% |
Similar Demographics by Nursery School
Demographics Similar to Immigrants from Central America by Nursery School
In terms of nursery school, the demographic groups most similar to Immigrants from Central America are Immigrants from Cabo Verde (96.4%, a difference of 0.020%), Immigrants from Guatemala (96.4%, a difference of 0.030%), Immigrants from Mexico (96.4%, a difference of 0.030%), Salvadoran (96.4%, a difference of 0.060%), and Immigrants from Cambodia (96.5%, a difference of 0.11%).
| Demographics | Rating | Rank | Nursery School |
| Central Americans | 0.0 /100 | #333 | Tragic 96.6% |
| Immigrants | Dominican Republic | 0.0 /100 | #334 | Tragic 96.6% |
| Bangladeshis | 0.0 /100 | #335 | Tragic 96.6% |
| Guatemalans | 0.0 /100 | #336 | Tragic 96.6% |
| Immigrants | Cambodia | 0.0 /100 | #337 | Tragic 96.5% |
| Immigrants | Fiji | 0.0 /100 | #338 | Tragic 96.5% |
| Immigrants | Guatemala | 0.0 /100 | #339 | Tragic 96.4% |
| Immigrants | Central America | 0.0 /100 | #340 | Tragic 96.4% |
| Immigrants | Cabo Verde | 0.0 /100 | #341 | Tragic 96.4% |
| Immigrants | Mexico | 0.0 /100 | #342 | Tragic 96.4% |
| Salvadorans | 0.0 /100 | #343 | Tragic 96.4% |
| Immigrants | El Salvador | 0.0 /100 | #344 | Tragic 96.2% |
| Nepalese | 0.0 /100 | #345 | Tragic 96.2% |
| Immigrants | Yemen | 0.0 /100 | #346 | Tragic 95.9% |
| Spanish American Indians | 0.0 /100 | #347 | Tragic 95.8% |
Demographics Similar to Immigrants from Lebanon by Nursery School
In terms of nursery school, the demographic groups most similar to Immigrants from Lebanon are Tohono O'odham (97.9%, a difference of 0.0%), Immigrants from Kenya (97.9%, a difference of 0.010%), Immigrants from Egypt (97.9%, a difference of 0.010%), Immigrants from Ukraine (97.9%, a difference of 0.010%), and Hawaiian (97.9%, a difference of 0.020%).
| Demographics | Rating | Rank | Nursery School |
| Mongolians | 27.3 /100 | #194 | Fair 97.9% |
| Hawaiians | 27.2 /100 | #195 | Fair 97.9% |
| Guamanians/Chamorros | 25.7 /100 | #196 | Fair 97.9% |
| Yuman | 25.7 /100 | #197 | Fair 97.9% |
| Immigrants | Kenya | 24.1 /100 | #198 | Fair 97.9% |
| Immigrants | Egypt | 22.5 /100 | #199 | Fair 97.9% |
| Tohono O'odham | 22.2 /100 | #200 | Fair 97.9% |
| Immigrants | Lebanon | 21.2 /100 | #201 | Fair 97.9% |
| Immigrants | Ukraine | 19.9 /100 | #202 | Poor 97.9% |
| Immigrants | Uganda | 18.0 /100 | #203 | Poor 97.9% |
| Immigrants | Southern Europe | 17.4 /100 | #204 | Poor 97.9% |
| Immigrants | Chile | 17.3 /100 | #205 | Poor 97.9% |
| Immigrants | Albania | 16.4 /100 | #206 | Poor 97.9% |
| Africans | 15.4 /100 | #207 | Poor 97.9% |
| Immigrants | Northern Africa | 11.7 /100 | #208 | Poor 97.8% |