Guyanese vs Sudanese Nursery School
COMPARE
Guyanese
Sudanese
Nursery School
Nursery School Comparison
Guyanese
Sudanese
97.0%
NURSERY SCHOOL
0.0/ 100
METRIC RATING
310th/ 347
METRIC RANK
97.7%
NURSERY SCHOOL
3.2/ 100
METRIC RATING
228th/ 347
METRIC RANK
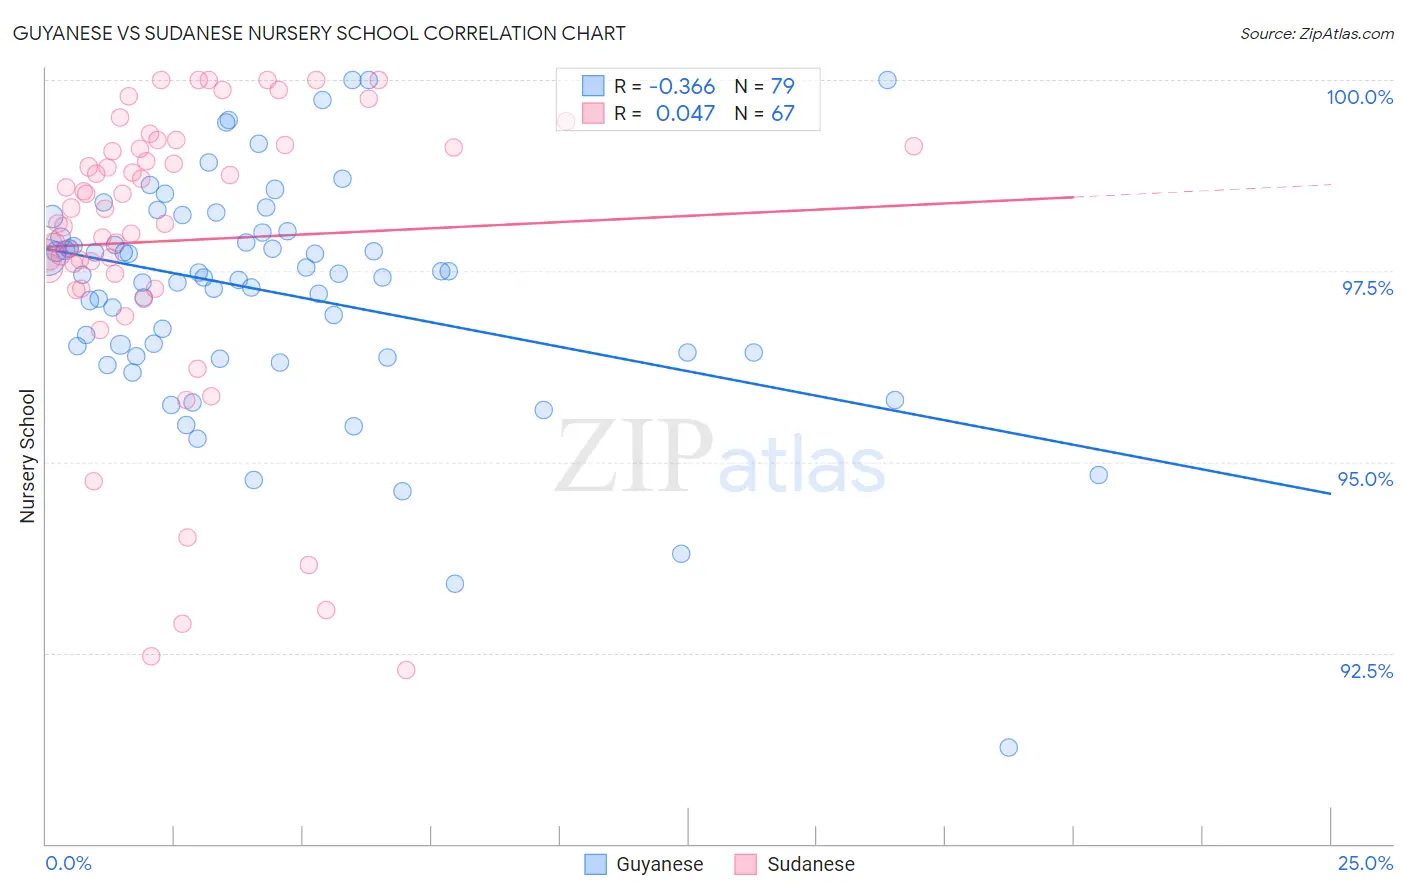
Guyanese vs Sudanese Nursery School Correlation Chart
The statistical analysis conducted on geographies consisting of 176,921,765 people shows a mild negative correlation between the proportion of Guyanese and percentage of population with at least nursery school education in the United States with a correlation coefficient (R) of -0.366 and weighted average of 97.0%. Similarly, the statistical analysis conducted on geographies consisting of 110,145,984 people shows no correlation between the proportion of Sudanese and percentage of population with at least nursery school education in the United States with a correlation coefficient (R) of 0.047 and weighted average of 97.7%, a difference of 0.77%.
Nursery School Correlation Summary
| Measurement | Guyanese | Sudanese |
| Minimum | 91.3% | 92.3% |
| Maximum | 100.0% | 100.0% |
| Range | 8.7% | 7.7% |
| Mean | 97.2% | 97.9% |
| Median | 97.4% | 98.3% |
| Interquartile 25% (IQ1) | 96.4% | 97.5% |
| Interquartile 75% (IQ3) | 98.0% | 99.1% |
| Interquartile Range (IQR) | 1.6% | 1.7% |
| Standard Deviation (Sample) | 1.5% | 1.9% |
| Standard Deviation (Population) | 1.5% | 1.9% |
Similar Demographics by Nursery School
Demographics Similar to Guyanese by Nursery School
In terms of nursery school, the demographic groups most similar to Guyanese are Immigrants from the Azores (97.0%, a difference of 0.0%), Sri Lankan (97.0%, a difference of 0.0%), Immigrants from Somalia (97.0%, a difference of 0.010%), Belizean (97.0%, a difference of 0.030%), and Hispanic or Latino (97.0%, a difference of 0.030%).
| Demographics | Rating | Rank | Nursery School |
| Nicaraguans | 0.0 /100 | #303 | Tragic 97.1% |
| Ecuadorians | 0.0 /100 | #304 | Tragic 97.1% |
| Somalis | 0.0 /100 | #305 | Tragic 97.1% |
| Belizeans | 0.0 /100 | #306 | Tragic 97.0% |
| Hispanics or Latinos | 0.0 /100 | #307 | Tragic 97.0% |
| Immigrants | Haiti | 0.0 /100 | #308 | Tragic 97.0% |
| Immigrants | Somalia | 0.0 /100 | #309 | Tragic 97.0% |
| Guyanese | 0.0 /100 | #310 | Tragic 97.0% |
| Immigrants | Azores | 0.0 /100 | #311 | Tragic 97.0% |
| Sri Lankans | 0.0 /100 | #312 | Tragic 97.0% |
| Hondurans | 0.0 /100 | #313 | Tragic 97.0% |
| Cape Verdeans | 0.0 /100 | #314 | Tragic 97.0% |
| Immigrants | Nicaragua | 0.0 /100 | #315 | Tragic 96.9% |
| Immigrants | Belize | 0.0 /100 | #316 | Tragic 96.9% |
| Immigrants | Ecuador | 0.0 /100 | #317 | Tragic 96.9% |
Demographics Similar to Sudanese by Nursery School
In terms of nursery school, the demographic groups most similar to Sudanese are Subsaharan African (97.7%, a difference of 0.0%), Senegalese (97.7%, a difference of 0.0%), Immigrants from Nepal (97.7%, a difference of 0.010%), Immigrants from Costa Rica (97.7%, a difference of 0.010%), and Iraqi (97.7%, a difference of 0.010%).
| Demographics | Rating | Rank | Nursery School |
| Tongans | 4.3 /100 | #221 | Tragic 97.8% |
| Immigrants | Syria | 4.0 /100 | #222 | Tragic 97.7% |
| Immigrants | Sudan | 3.9 /100 | #223 | Tragic 97.7% |
| Immigrants | Nepal | 3.6 /100 | #224 | Tragic 97.7% |
| Immigrants | Costa Rica | 3.5 /100 | #225 | Tragic 97.7% |
| Iraqis | 3.5 /100 | #226 | Tragic 97.7% |
| Sub-Saharan Africans | 3.2 /100 | #227 | Tragic 97.7% |
| Sudanese | 3.2 /100 | #228 | Tragic 97.7% |
| Senegalese | 3.2 /100 | #229 | Tragic 97.7% |
| Sierra Leoneans | 2.9 /100 | #230 | Tragic 97.7% |
| Puerto Ricans | 2.6 /100 | #231 | Tragic 97.7% |
| Immigrants | Uruguay | 2.3 /100 | #232 | Tragic 97.7% |
| U.S. Virgin Islanders | 2.1 /100 | #233 | Tragic 97.7% |
| Colombians | 2.1 /100 | #234 | Tragic 97.7% |
| Immigrants | Pakistan | 2.1 /100 | #235 | Tragic 97.7% |