Immigrants from Caribbean vs Luxembourger Median Male Earnings
COMPARE
Immigrants from Caribbean
Luxembourger
Median Male Earnings
Median Male Earnings Comparison
Immigrants from Caribbean
Luxembourgers
$46,193
MEDIAN MALE EARNINGS
0.0/ 100
METRIC RATING
316th/ 347
METRIC RANK
$56,300
MEDIAN MALE EARNINGS
85.5/ 100
METRIC RATING
140th/ 347
METRIC RANK
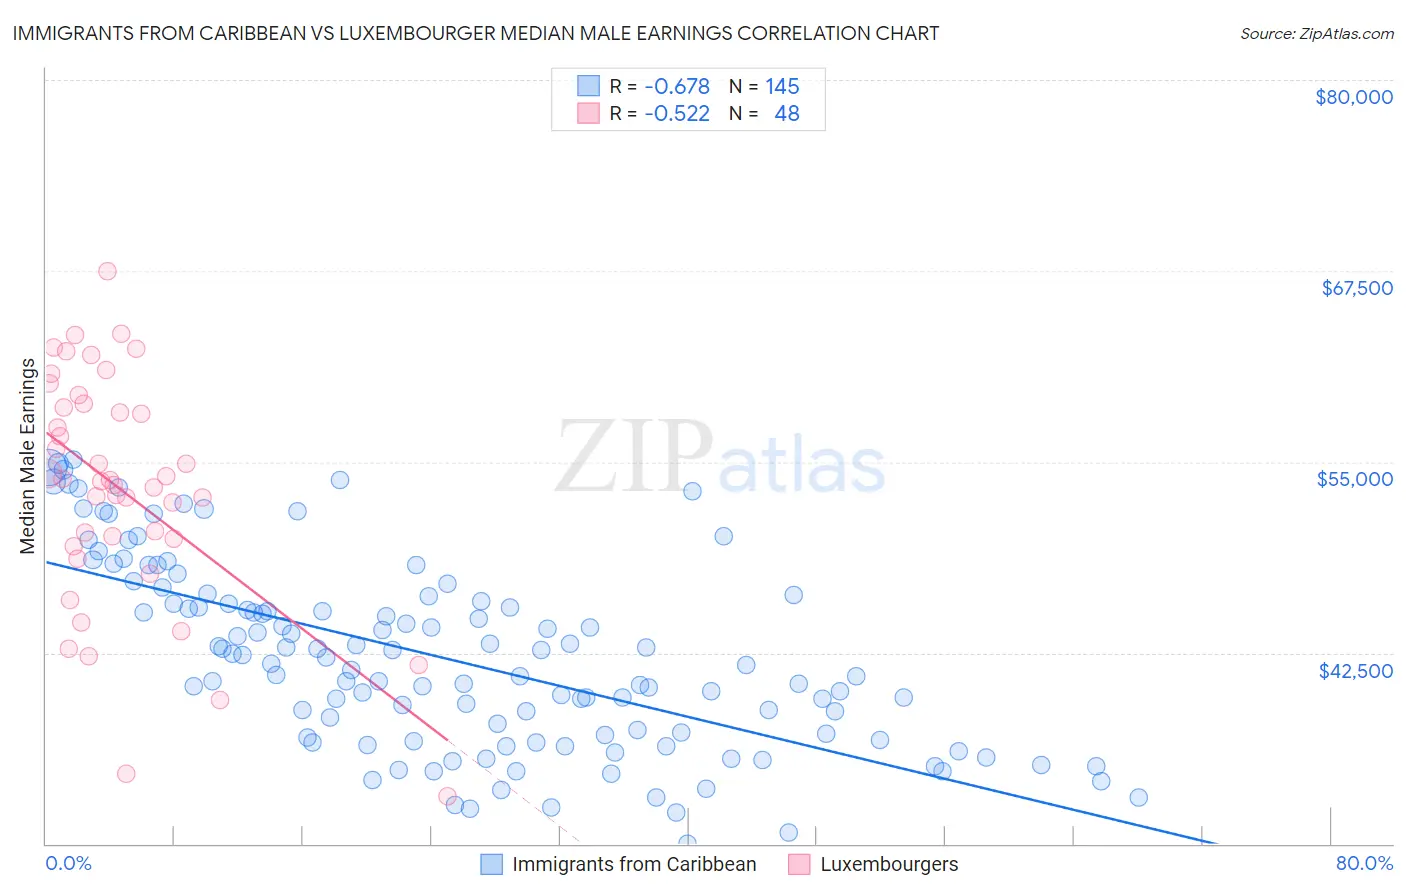
Immigrants from Caribbean vs Luxembourger Median Male Earnings Correlation Chart
The statistical analysis conducted on geographies consisting of 449,789,932 people shows a significant negative correlation between the proportion of Immigrants from Caribbean and median male earnings in the United States with a correlation coefficient (R) of -0.678 and weighted average of $46,193. Similarly, the statistical analysis conducted on geographies consisting of 144,673,100 people shows a substantial negative correlation between the proportion of Luxembourgers and median male earnings in the United States with a correlation coefficient (R) of -0.522 and weighted average of $56,300, a difference of 21.9%.
Median Male Earnings Correlation Summary
| Measurement | Immigrants from Caribbean | Luxembourger |
| Minimum | $30,010 | $33,125 |
| Maximum | $55,142 | $67,500 |
| Range | $25,132 | $34,375 |
| Mean | $42,215 | $53,182 |
| Median | $41,809 | $53,767 |
| Interquartile 25% (IQ1) | $37,054 | $49,758 |
| Interquartile 75% (IQ3) | $46,037 | $58,691 |
| Interquartile Range (IQR) | $8,984 | $8,933 |
| Standard Deviation (Sample) | $6,100 | $7,604 |
| Standard Deviation (Population) | $6,079 | $7,525 |
Similar Demographics by Median Male Earnings
Demographics Similar to Immigrants from Caribbean by Median Male Earnings
In terms of median male earnings, the demographic groups most similar to Immigrants from Caribbean are Mexican ($46,147, a difference of 0.10%), Immigrants from Guatemala ($46,244, a difference of 0.11%), Cheyenne ($46,062, a difference of 0.28%), Chippewa ($46,368, a difference of 0.38%), and Honduran ($46,374, a difference of 0.39%).
| Demographics | Rating | Rank | Median Male Earnings |
| Creek | 0.0 /100 | #309 | Tragic $46,594 |
| Cubans | 0.0 /100 | #310 | Tragic $46,580 |
| Apache | 0.0 /100 | #311 | Tragic $46,429 |
| Hispanics or Latinos | 0.0 /100 | #312 | Tragic $46,419 |
| Hondurans | 0.0 /100 | #313 | Tragic $46,374 |
| Chippewa | 0.0 /100 | #314 | Tragic $46,368 |
| Immigrants | Guatemala | 0.0 /100 | #315 | Tragic $46,244 |
| Immigrants | Caribbean | 0.0 /100 | #316 | Tragic $46,193 |
| Mexicans | 0.0 /100 | #317 | Tragic $46,147 |
| Cheyenne | 0.0 /100 | #318 | Tragic $46,062 |
| Haitians | 0.0 /100 | #319 | Tragic $45,903 |
| Immigrants | Honduras | 0.0 /100 | #320 | Tragic $45,787 |
| Fijians | 0.0 /100 | #321 | Tragic $45,607 |
| Sioux | 0.0 /100 | #322 | Tragic $45,566 |
| Immigrants | Central America | 0.0 /100 | #323 | Tragic $45,538 |
Demographics Similar to Luxembourgers by Median Male Earnings
In terms of median male earnings, the demographic groups most similar to Luxembourgers are Zimbabwean ($56,302, a difference of 0.0%), Slovak ($56,306, a difference of 0.010%), Danish ($56,246, a difference of 0.10%), Ethiopian ($56,243, a difference of 0.10%), and Slavic ($56,390, a difference of 0.16%).
| Demographics | Rating | Rank | Median Male Earnings |
| Immigrants | Germany | 88.2 /100 | #133 | Excellent $56,542 |
| Moroccans | 87.7 /100 | #134 | Excellent $56,499 |
| Irish | 87.4 /100 | #135 | Excellent $56,464 |
| Immigrants | Saudi Arabia | 87.2 /100 | #136 | Excellent $56,452 |
| Slavs | 86.5 /100 | #137 | Excellent $56,390 |
| Slovaks | 85.5 /100 | #138 | Excellent $56,306 |
| Zimbabweans | 85.5 /100 | #139 | Excellent $56,302 |
| Luxembourgers | 85.5 /100 | #140 | Excellent $56,300 |
| Danes | 84.8 /100 | #141 | Excellent $56,246 |
| Ethiopians | 84.8 /100 | #142 | Excellent $56,243 |
| Sri Lankans | 83.4 /100 | #143 | Excellent $56,136 |
| Immigrants | Uganda | 82.4 /100 | #144 | Excellent $56,064 |
| Norwegians | 80.9 /100 | #145 | Excellent $55,965 |
| Immigrants | Chile | 80.7 /100 | #146 | Excellent $55,954 |
| Immigrants | Philippines | 78.4 /100 | #147 | Good $55,809 |