Immigrants from Caribbean vs Japanese 12th Grade, No Diploma
COMPARE
Immigrants from Caribbean
Japanese
12th Grade, No Diploma
12th Grade, No Diploma Comparison
Immigrants from Caribbean
Japanese
87.4%
12TH GRADE, NO DIPLOMA
0.0/ 100
METRIC RATING
313th/ 347
METRIC RANK
88.3%
12TH GRADE, NO DIPLOMA
0.0/ 100
METRIC RATING
293rd/ 347
METRIC RANK
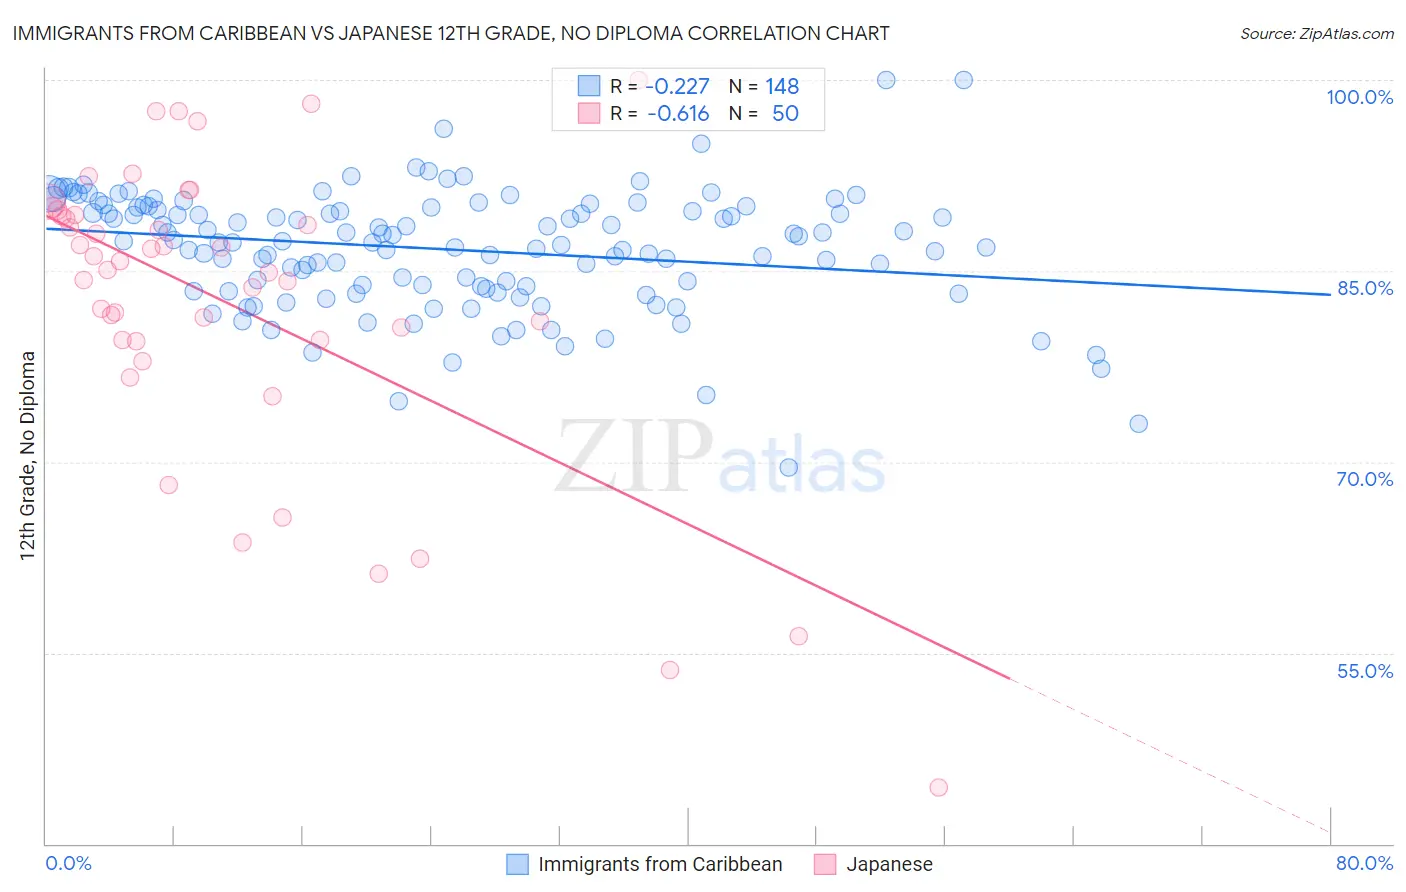
Immigrants from Caribbean vs Japanese 12th Grade, No Diploma Correlation Chart
The statistical analysis conducted on geographies consisting of 450,064,731 people shows a weak negative correlation between the proportion of Immigrants from Caribbean and percentage of population with at least 12th grade (no diploma) education in the United States with a correlation coefficient (R) of -0.227 and weighted average of 87.4%. Similarly, the statistical analysis conducted on geographies consisting of 249,183,224 people shows a significant negative correlation between the proportion of Japanese and percentage of population with at least 12th grade (no diploma) education in the United States with a correlation coefficient (R) of -0.616 and weighted average of 88.3%, a difference of 1.1%.
12th Grade, No Diploma Correlation Summary
| Measurement | Immigrants from Caribbean | Japanese |
| Minimum | 69.6% | 44.4% |
| Maximum | 100.0% | 100.0% |
| Range | 30.4% | 55.6% |
| Mean | 86.7% | 82.5% |
| Median | 87.3% | 85.4% |
| Interquartile 25% (IQ1) | 83.7% | 79.6% |
| Interquartile 75% (IQ3) | 90.0% | 89.4% |
| Interquartile Range (IQR) | 6.3% | 9.8% |
| Standard Deviation (Sample) | 4.7% | 11.9% |
| Standard Deviation (Population) | 4.7% | 11.8% |
Demographics Similar to Immigrants from Caribbean and Japanese by 12th Grade, No Diploma
In terms of 12th grade, no diploma, the demographic groups most similar to Immigrants from Caribbean are Yaqui (87.5%, a difference of 0.12%), Immigrants from Ecuador (87.5%, a difference of 0.12%), Immigrants from Cuba (87.5%, a difference of 0.16%), Immigrants from Armenia (87.6%, a difference of 0.21%), and Yup'ik (87.6%, a difference of 0.24%). Similarly, the demographic groups most similar to Japanese are Guyanese (88.3%, a difference of 0.070%), Immigrants (88.2%, a difference of 0.11%), Fijian (88.2%, a difference of 0.13%), Pueblo (88.2%, a difference of 0.14%), and Immigrants from Haiti (88.2%, a difference of 0.19%).
| Demographics | Rating | Rank | 12th Grade, No Diploma |
| Japanese | 0.0 /100 | #293 | Tragic 88.3% |
| Guyanese | 0.0 /100 | #294 | Tragic 88.3% |
| Immigrants | Immigrants | 0.0 /100 | #295 | Tragic 88.2% |
| Fijians | 0.0 /100 | #296 | Tragic 88.2% |
| Pueblo | 0.0 /100 | #297 | Tragic 88.2% |
| Immigrants | Haiti | 0.0 /100 | #298 | Tragic 88.2% |
| Nepalese | 0.0 /100 | #299 | Tragic 88.1% |
| Immigrants | Guyana | 0.0 /100 | #300 | Tragic 88.1% |
| Immigrants | Cambodia | 0.0 /100 | #301 | Tragic 88.1% |
| Ecuadorians | 0.0 /100 | #302 | Tragic 88.0% |
| Immigrants | Bangladesh | 0.0 /100 | #303 | Tragic 88.0% |
| Vietnamese | 0.0 /100 | #304 | Tragic 87.9% |
| Immigrants | Dominica | 0.0 /100 | #305 | Tragic 87.7% |
| Natives/Alaskans | 0.0 /100 | #306 | Tragic 87.7% |
| Immigrants | Portugal | 0.0 /100 | #307 | Tragic 87.6% |
| Yup'ik | 0.0 /100 | #308 | Tragic 87.6% |
| Immigrants | Armenia | 0.0 /100 | #309 | Tragic 87.6% |
| Immigrants | Cuba | 0.0 /100 | #310 | Tragic 87.5% |
| Yaqui | 0.0 /100 | #311 | Tragic 87.5% |
| Immigrants | Ecuador | 0.0 /100 | #312 | Tragic 87.5% |
| Immigrants | Caribbean | 0.0 /100 | #313 | Tragic 87.4% |