Immigrants from Cameroon vs Immigrants from Grenada Single Father Households
COMPARE
Immigrants from Cameroon
Immigrants from Grenada
Single Father Households
Single Father Households Comparison
Immigrants from Cameroon
Immigrants from Grenada
2.5%
SINGLE FATHER HOUSEHOLDS
2.3/ 100
METRIC RATING
249th/ 347
METRIC RANK
2.0%
SINGLE FATHER HOUSEHOLDS
100.0/ 100
METRIC RATING
43rd/ 347
METRIC RANK
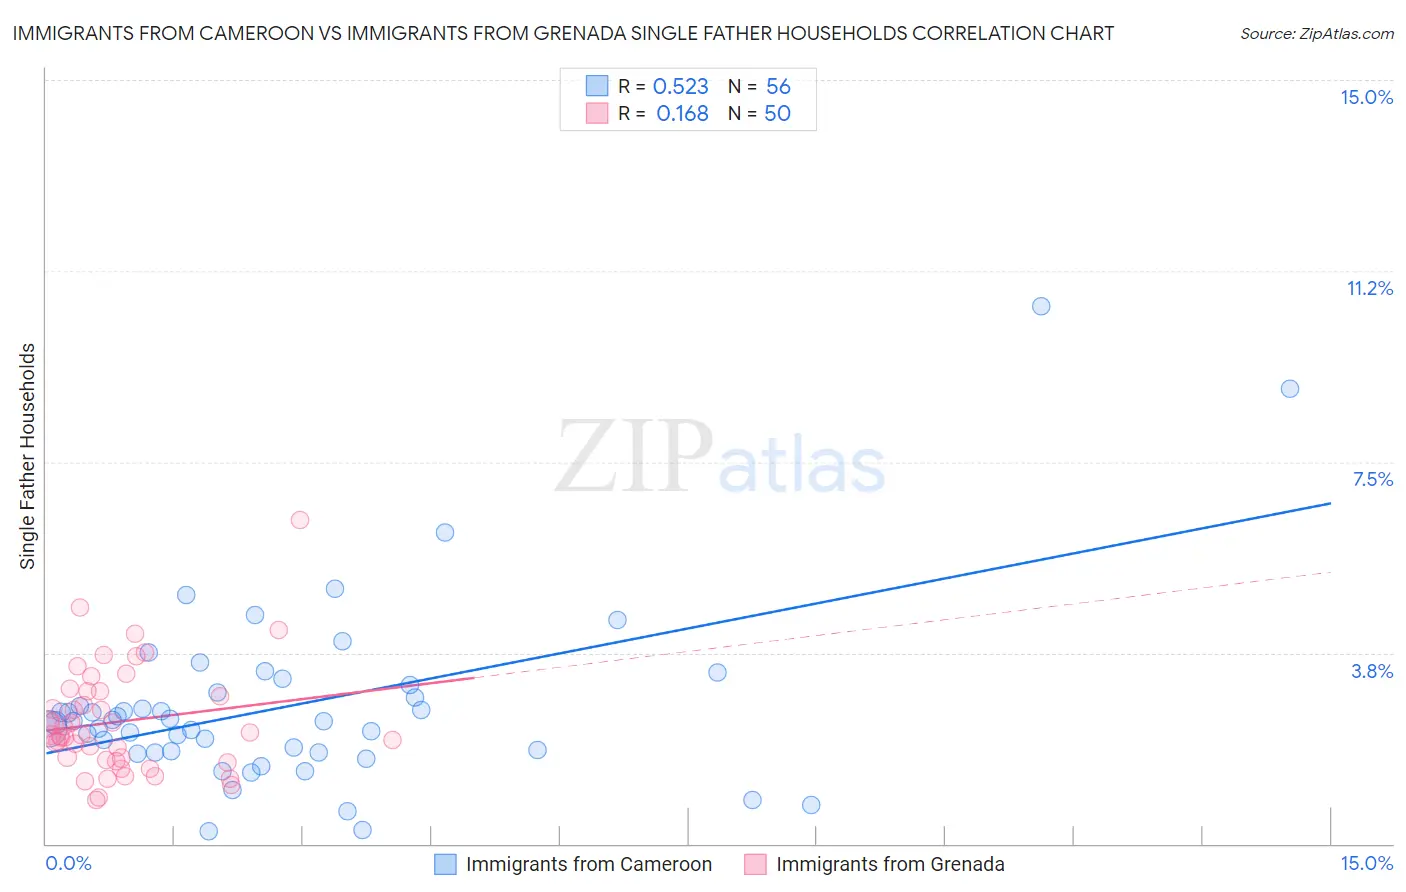
Immigrants from Cameroon vs Immigrants from Grenada Single Father Households Correlation Chart
The statistical analysis conducted on geographies consisting of 130,430,432 people shows a substantial positive correlation between the proportion of Immigrants from Cameroon and percentage of single father households in the United States with a correlation coefficient (R) of 0.523 and weighted average of 2.5%. Similarly, the statistical analysis conducted on geographies consisting of 67,096,407 people shows a poor positive correlation between the proportion of Immigrants from Grenada and percentage of single father households in the United States with a correlation coefficient (R) of 0.168 and weighted average of 2.0%, a difference of 24.7%.
Single Father Households Correlation Summary
| Measurement | Immigrants from Cameroon | Immigrants from Grenada |
| Minimum | 0.24% | 0.86% |
| Maximum | 10.6% | 6.4% |
| Range | 10.3% | 5.5% |
| Mean | 2.7% | 2.4% |
| Median | 2.4% | 2.1% |
| Interquartile 25% (IQ1) | 1.8% | 1.6% |
| Interquartile 75% (IQ3) | 3.0% | 3.0% |
| Interquartile Range (IQR) | 1.2% | 1.3% |
| Standard Deviation (Sample) | 1.8% | 1.1% |
| Standard Deviation (Population) | 1.8% | 1.0% |
Similar Demographics by Single Father Households
Demographics Similar to Immigrants from Cameroon by Single Father Households
In terms of single father households, the demographic groups most similar to Immigrants from Cameroon are Bahamian (2.5%, a difference of 0.090%), Delaware (2.5%, a difference of 0.13%), Native Hawaiian (2.5%, a difference of 0.14%), Basque (2.5%, a difference of 0.16%), and Somali (2.5%, a difference of 0.17%).
| Demographics | Rating | Rank | Single Father Households |
| Osage | 4.1 /100 | #242 | Tragic 2.5% |
| Spaniards | 3.1 /100 | #243 | Tragic 2.5% |
| Immigrants | Middle Africa | 2.8 /100 | #244 | Tragic 2.5% |
| Basques | 2.5 /100 | #245 | Tragic 2.5% |
| Native Hawaiians | 2.5 /100 | #246 | Tragic 2.5% |
| Delaware | 2.5 /100 | #247 | Tragic 2.5% |
| Bahamians | 2.4 /100 | #248 | Tragic 2.5% |
| Immigrants | Cameroon | 2.3 /100 | #249 | Tragic 2.5% |
| Somalis | 2.1 /100 | #250 | Tragic 2.5% |
| Liberians | 2.0 /100 | #251 | Tragic 2.5% |
| Immigrants | Eritrea | 2.0 /100 | #252 | Tragic 2.5% |
| Immigrants | Somalia | 1.9 /100 | #253 | Tragic 2.5% |
| Immigrants | Thailand | 1.8 /100 | #254 | Tragic 2.5% |
| Tongans | 1.5 /100 | #255 | Tragic 2.5% |
| Potawatomi | 1.4 /100 | #256 | Tragic 2.5% |
Demographics Similar to Immigrants from Grenada by Single Father Households
In terms of single father households, the demographic groups most similar to Immigrants from Grenada are Latvian (2.0%, a difference of 0.090%), Russian (2.0%, a difference of 0.10%), Immigrants from Lebanon (2.0%, a difference of 0.21%), Macedonian (2.0%, a difference of 0.23%), and Immigrants from Turkey (2.0%, a difference of 0.38%).
| Demographics | Rating | Rank | Single Father Households |
| Immigrants | Belgium | 100.0 /100 | #36 | Exceptional 2.0% |
| Immigrants | St. Vincent and the Grenadines | 100.0 /100 | #37 | Exceptional 2.0% |
| Immigrants | Eastern Europe | 100.0 /100 | #38 | Exceptional 2.0% |
| Immigrants | Sri Lanka | 100.0 /100 | #39 | Exceptional 2.0% |
| Immigrants | Bulgaria | 100.0 /100 | #40 | Exceptional 2.0% |
| Immigrants | Turkey | 100.0 /100 | #41 | Exceptional 2.0% |
| Macedonians | 100.0 /100 | #42 | Exceptional 2.0% |
| Immigrants | Grenada | 100.0 /100 | #43 | Exceptional 2.0% |
| Latvians | 100.0 /100 | #44 | Exceptional 2.0% |
| Russians | 100.0 /100 | #45 | Exceptional 2.0% |
| Immigrants | Lebanon | 100.0 /100 | #46 | Exceptional 2.0% |
| Immigrants | Ukraine | 99.9 /100 | #47 | Exceptional 2.0% |
| Immigrants | Kazakhstan | 99.9 /100 | #48 | Exceptional 2.0% |
| Immigrants | Serbia | 99.9 /100 | #49 | Exceptional 2.0% |
| Immigrants | Switzerland | 99.9 /100 | #50 | Exceptional 2.0% |