Immigrants from Cambodia vs White/Caucasian Master's Degree
COMPARE
Immigrants from Cambodia
White/Caucasian
Master's Degree
Master's Degree Comparison
Immigrants from Cambodia
Whites/Caucasians
12.9%
MASTER'S DEGREE
1.4/ 100
METRIC RATING
246th/ 347
METRIC RANK
13.8%
MASTER'S DEGREE
9.1/ 100
METRIC RATING
228th/ 347
METRIC RANK
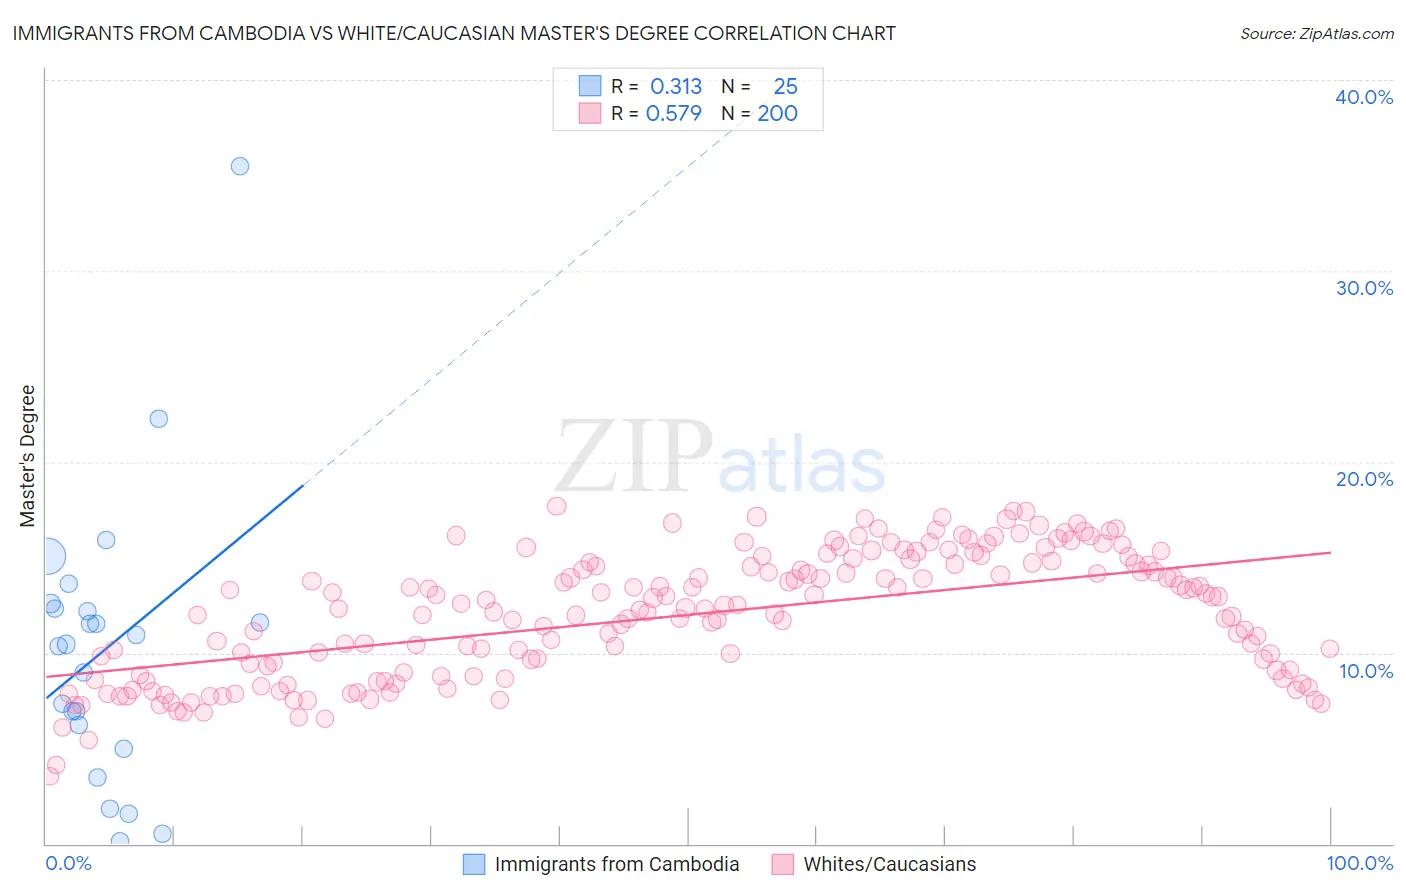
Immigrants from Cambodia vs White/Caucasian Master's Degree Correlation Chart
The statistical analysis conducted on geographies consisting of 205,124,536 people shows a mild positive correlation between the proportion of Immigrants from Cambodia and percentage of population with at least master's degree education in the United States with a correlation coefficient (R) of 0.313 and weighted average of 12.9%. Similarly, the statistical analysis conducted on geographies consisting of 583,022,214 people shows a substantial positive correlation between the proportion of Whites/Caucasians and percentage of population with at least master's degree education in the United States with a correlation coefficient (R) of 0.579 and weighted average of 13.8%, a difference of 7.1%.
Master's Degree Correlation Summary
| Measurement | Immigrants from Cambodia | White/Caucasian |
| Minimum | 0.16% | 3.5% |
| Maximum | 35.5% | 17.7% |
| Range | 35.3% | 14.2% |
| Mean | 10.2% | 12.0% |
| Median | 10.4% | 12.3% |
| Interquartile 25% (IQ1) | 5.6% | 8.9% |
| Interquartile 75% (IQ3) | 12.5% | 14.7% |
| Interquartile Range (IQR) | 6.9% | 5.8% |
| Standard Deviation (Sample) | 7.4% | 3.2% |
| Standard Deviation (Population) | 7.3% | 3.2% |
Demographics Similar to Immigrants from Cambodia and Whites/Caucasians by Master's Degree
In terms of master's degree, the demographic groups most similar to Immigrants from Cambodia are Iroquois (12.9%, a difference of 0.030%), Immigrants from Bahamas (12.9%, a difference of 0.040%), Delaware (13.0%, a difference of 0.70%), Immigrants from Jamaica (13.0%, a difference of 1.1%), and Spanish American (13.0%, a difference of 1.1%). Similarly, the demographic groups most similar to Whites/Caucasians are British West Indian (13.8%, a difference of 0.10%), Dutch (13.8%, a difference of 0.14%), Immigrants from West Indies (13.9%, a difference of 0.31%), Guyanese (13.7%, a difference of 0.68%), and Immigrants from Philippines (13.6%, a difference of 1.6%).
| Demographics | Rating | Rank | Master's Degree |
| Immigrants | West Indies | 9.8 /100 | #227 | Tragic 13.9% |
| Whites/Caucasians | 9.1 /100 | #228 | Tragic 13.8% |
| British West Indians | 8.8 /100 | #229 | Tragic 13.8% |
| Dutch | 8.7 /100 | #230 | Tragic 13.8% |
| Guyanese | 7.6 /100 | #231 | Tragic 13.7% |
| Immigrants | Philippines | 6.0 /100 | #232 | Tragic 13.6% |
| Immigrants | Ecuador | 5.7 /100 | #233 | Tragic 13.6% |
| Immigrants | Burma/Myanmar | 5.0 /100 | #234 | Tragic 13.5% |
| German Russians | 4.5 /100 | #235 | Tragic 13.5% |
| Immigrants | Guyana | 4.4 /100 | #236 | Tragic 13.4% |
| Jamaicans | 4.1 /100 | #237 | Tragic 13.4% |
| Hmong | 4.0 /100 | #238 | Tragic 13.4% |
| Immigrants | Nonimmigrants | 3.4 /100 | #239 | Tragic 13.3% |
| Guamanians/Chamorros | 2.2 /100 | #240 | Tragic 13.1% |
| U.S. Virgin Islanders | 2.1 /100 | #241 | Tragic 13.1% |
| Spanish Americans | 1.9 /100 | #242 | Tragic 13.0% |
| Immigrants | Jamaica | 1.9 /100 | #243 | Tragic 13.0% |
| Delaware | 1.7 /100 | #244 | Tragic 13.0% |
| Immigrants | Bahamas | 1.4 /100 | #245 | Tragic 12.9% |
| Immigrants | Cambodia | 1.4 /100 | #246 | Tragic 12.9% |
| Iroquois | 1.4 /100 | #247 | Tragic 12.9% |