Immigrants from Cambodia vs Bolivian Master's Degree
COMPARE
Immigrants from Cambodia
Bolivian
Master's Degree
Master's Degree Comparison
Immigrants from Cambodia
Bolivians
12.9%
MASTER'S DEGREE
1.4/ 100
METRIC RATING
246th/ 347
METRIC RANK
19.3%
MASTER'S DEGREE
100.0/ 100
METRIC RATING
38th/ 347
METRIC RANK
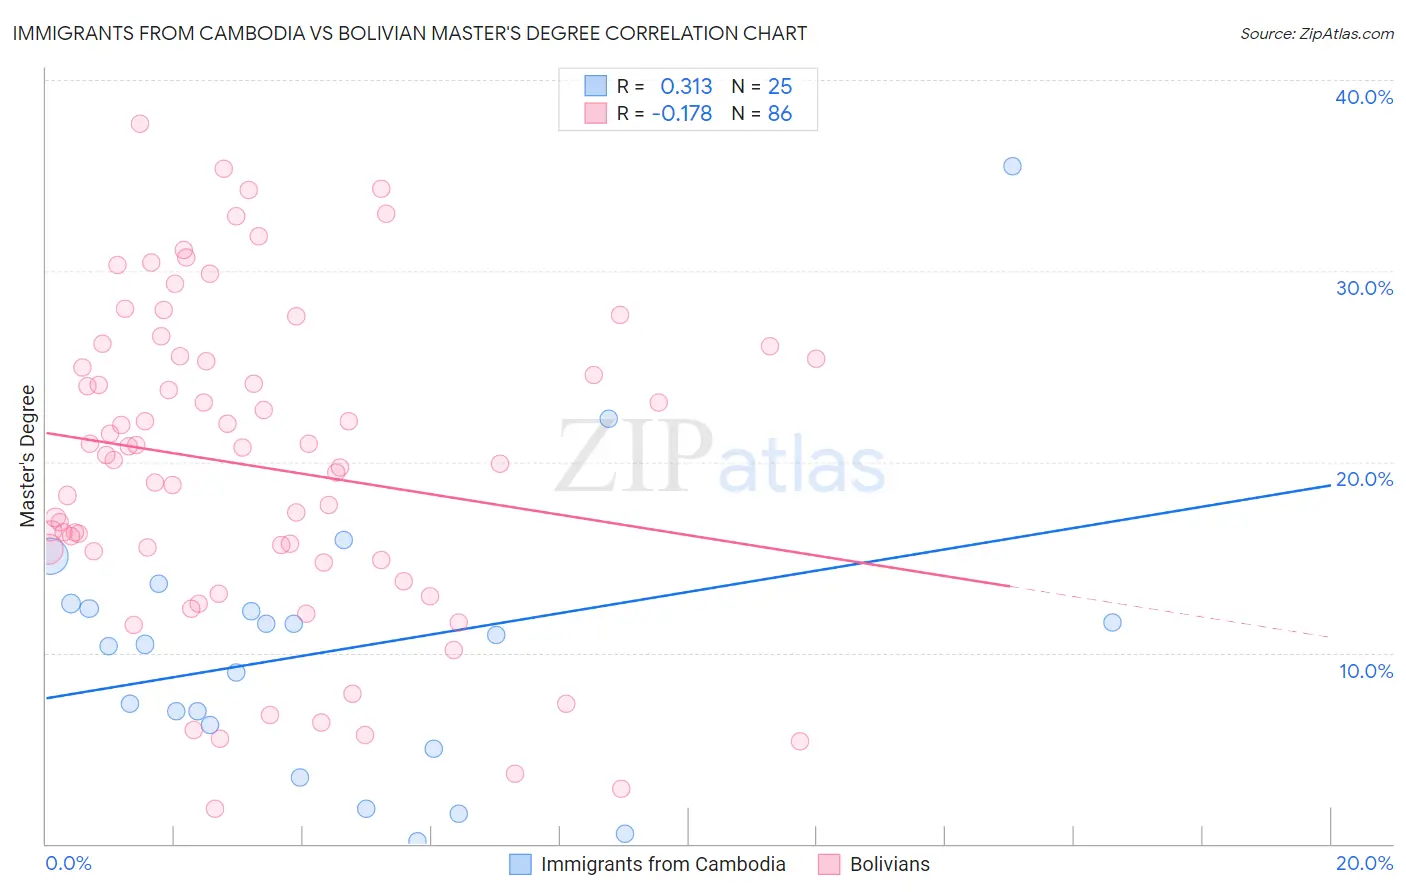
Immigrants from Cambodia vs Bolivian Master's Degree Correlation Chart
The statistical analysis conducted on geographies consisting of 205,124,536 people shows a mild positive correlation between the proportion of Immigrants from Cambodia and percentage of population with at least master's degree education in the United States with a correlation coefficient (R) of 0.313 and weighted average of 12.9%. Similarly, the statistical analysis conducted on geographies consisting of 184,652,139 people shows a poor negative correlation between the proportion of Bolivians and percentage of population with at least master's degree education in the United States with a correlation coefficient (R) of -0.178 and weighted average of 19.3%, a difference of 49.3%.
Master's Degree Correlation Summary
| Measurement | Immigrants from Cambodia | Bolivian |
| Minimum | 0.16% | 1.8% |
| Maximum | 35.5% | 37.7% |
| Range | 35.3% | 35.9% |
| Mean | 10.2% | 19.7% |
| Median | 10.4% | 20.2% |
| Interquartile 25% (IQ1) | 5.6% | 14.9% |
| Interquartile 75% (IQ3) | 12.5% | 25.4% |
| Interquartile Range (IQR) | 6.9% | 10.5% |
| Standard Deviation (Sample) | 7.4% | 8.3% |
| Standard Deviation (Population) | 7.3% | 8.3% |
Similar Demographics by Master's Degree
Demographics Similar to Immigrants from Cambodia by Master's Degree
In terms of master's degree, the demographic groups most similar to Immigrants from Cambodia are Iroquois (12.9%, a difference of 0.030%), Immigrants from Bahamas (12.9%, a difference of 0.040%), African (12.9%, a difference of 0.12%), Cree (12.8%, a difference of 0.43%), and Liberian (12.8%, a difference of 0.44%).
| Demographics | Rating | Rank | Master's Degree |
| Immigrants | Nonimmigrants | 3.4 /100 | #239 | Tragic 13.3% |
| Guamanians/Chamorros | 2.2 /100 | #240 | Tragic 13.1% |
| U.S. Virgin Islanders | 2.1 /100 | #241 | Tragic 13.1% |
| Spanish Americans | 1.9 /100 | #242 | Tragic 13.0% |
| Immigrants | Jamaica | 1.9 /100 | #243 | Tragic 13.0% |
| Delaware | 1.7 /100 | #244 | Tragic 13.0% |
| Immigrants | Bahamas | 1.4 /100 | #245 | Tragic 12.9% |
| Immigrants | Cambodia | 1.4 /100 | #246 | Tragic 12.9% |
| Iroquois | 1.4 /100 | #247 | Tragic 12.9% |
| Africans | 1.4 /100 | #248 | Tragic 12.9% |
| Cree | 1.3 /100 | #249 | Tragic 12.8% |
| Liberians | 1.3 /100 | #250 | Tragic 12.8% |
| Tlingit-Haida | 1.3 /100 | #251 | Tragic 12.8% |
| French American Indians | 1.0 /100 | #252 | Tragic 12.7% |
| Immigrants | Dominica | 0.8 /100 | #253 | Tragic 12.6% |
Demographics Similar to Bolivians by Master's Degree
In terms of master's degree, the demographic groups most similar to Bolivians are Immigrants from Spain (19.1%, a difference of 0.64%), Mongolian (19.4%, a difference of 0.69%), Immigrants from Russia (19.4%, a difference of 0.73%), Immigrants from Bolivia (19.1%, a difference of 0.77%), and Immigrants from Northern Europe (19.5%, a difference of 1.1%).
| Demographics | Rating | Rank | Master's Degree |
| Immigrants | Korea | 100.0 /100 | #31 | Exceptional 19.7% |
| Burmese | 100.0 /100 | #32 | Exceptional 19.7% |
| Russians | 100.0 /100 | #33 | Exceptional 19.5% |
| Immigrants | Denmark | 100.0 /100 | #34 | Exceptional 19.5% |
| Immigrants | Northern Europe | 100.0 /100 | #35 | Exceptional 19.5% |
| Immigrants | Russia | 100.0 /100 | #36 | Exceptional 19.4% |
| Mongolians | 100.0 /100 | #37 | Exceptional 19.4% |
| Bolivians | 100.0 /100 | #38 | Exceptional 19.3% |
| Immigrants | Spain | 100.0 /100 | #39 | Exceptional 19.1% |
| Immigrants | Bolivia | 100.0 /100 | #40 | Exceptional 19.1% |
| Immigrants | Latvia | 100.0 /100 | #41 | Exceptional 19.1% |
| Immigrants | Saudi Arabia | 100.0 /100 | #42 | Exceptional 19.0% |
| Immigrants | Greece | 100.0 /100 | #43 | Exceptional 19.0% |
| Immigrants | Malaysia | 100.0 /100 | #44 | Exceptional 18.9% |
| Immigrants | Belarus | 100.0 /100 | #45 | Exceptional 18.9% |