Immigrants from Cambodia vs Indian (Asian) Associate's Degree
COMPARE
Immigrants from Cambodia
Indian (Asian)
Associate's Degree
Associate's Degree Comparison
Immigrants from Cambodia
Indians (Asian)
42.3%
ASSOCIATE'S DEGREE
0.9/ 100
METRIC RATING
245th/ 347
METRIC RANK
54.8%
ASSOCIATE'S DEGREE
100.0/ 100
METRIC RATING
18th/ 347
METRIC RANK
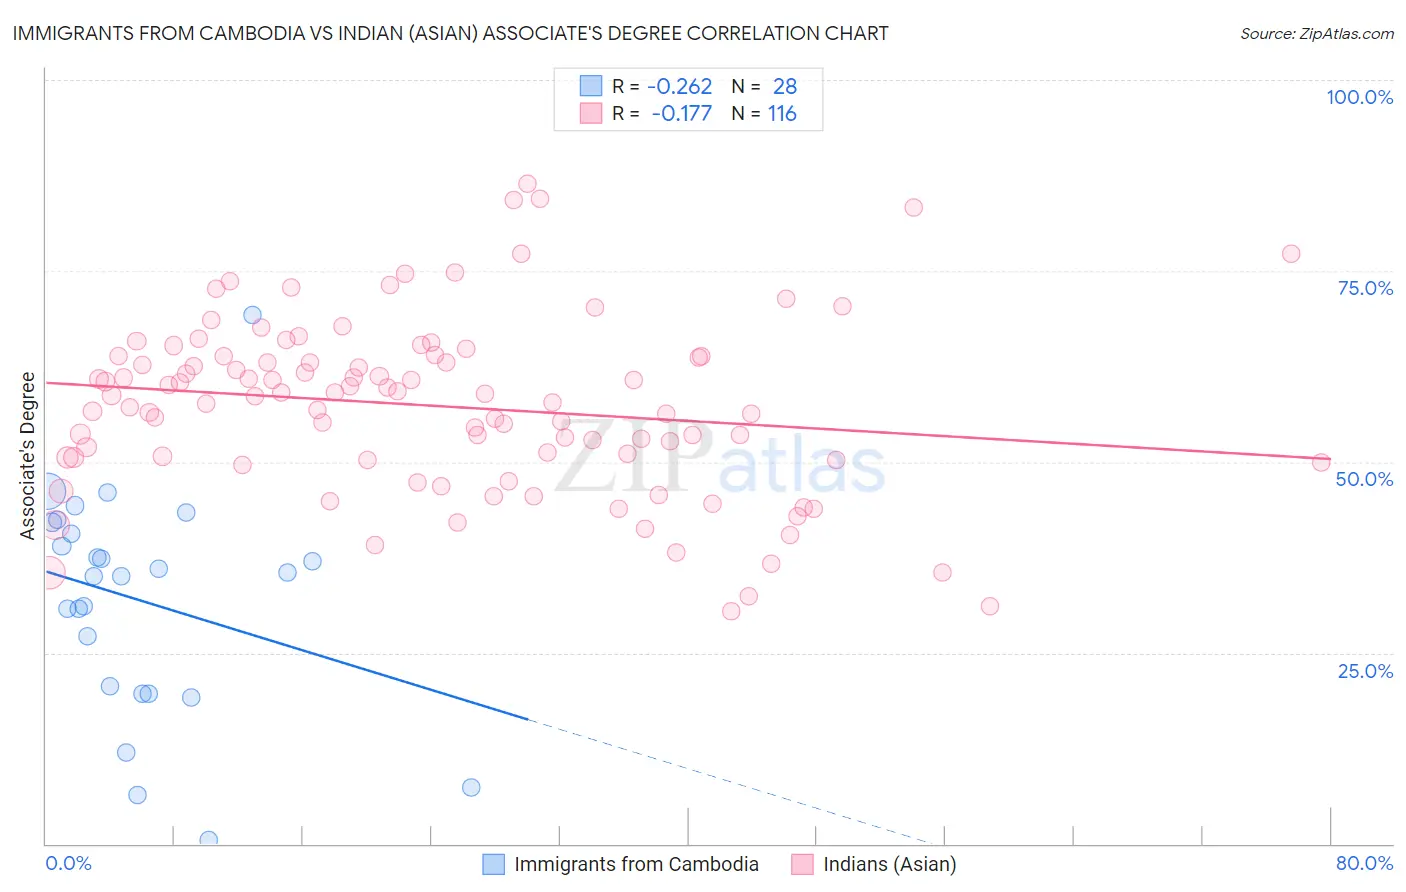
Immigrants from Cambodia vs Indian (Asian) Associate's Degree Correlation Chart
The statistical analysis conducted on geographies consisting of 205,153,213 people shows a weak negative correlation between the proportion of Immigrants from Cambodia and percentage of population with at least associate's degree education in the United States with a correlation coefficient (R) of -0.262 and weighted average of 42.3%. Similarly, the statistical analysis conducted on geographies consisting of 495,274,508 people shows a poor negative correlation between the proportion of Indians (Asian) and percentage of population with at least associate's degree education in the United States with a correlation coefficient (R) of -0.177 and weighted average of 54.8%, a difference of 29.6%.
Associate's Degree Correlation Summary
| Measurement | Immigrants from Cambodia | Indian (Asian) |
| Minimum | 0.50% | 30.4% |
| Maximum | 69.2% | 86.5% |
| Range | 68.7% | 56.1% |
| Mean | 31.9% | 57.3% |
| Median | 35.3% | 58.6% |
| Interquartile 25% (IQ1) | 20.1% | 50.4% |
| Interquartile 75% (IQ3) | 41.4% | 63.9% |
| Interquartile Range (IQR) | 21.2% | 13.4% |
| Standard Deviation (Sample) | 14.7% | 11.5% |
| Standard Deviation (Population) | 14.4% | 11.4% |
Similar Demographics by Associate's Degree
Demographics Similar to Immigrants from Cambodia by Associate's Degree
In terms of associate's degree, the demographic groups most similar to Immigrants from Cambodia are Immigrants from Liberia (42.3%, a difference of 0.020%), Delaware (42.3%, a difference of 0.030%), Immigrants from Fiji (42.2%, a difference of 0.12%), Guyanese (42.3%, a difference of 0.16%), and Immigrants from Ecuador (42.2%, a difference of 0.20%).
| Demographics | Rating | Rank | Associate's Degree |
| Iroquois | 1.7 /100 | #238 | Tragic 42.8% |
| Immigrants | Grenada | 1.3 /100 | #239 | Tragic 42.6% |
| Cree | 1.2 /100 | #240 | Tragic 42.5% |
| British West Indians | 1.0 /100 | #241 | Tragic 42.4% |
| Immigrants | West Indies | 1.0 /100 | #242 | Tragic 42.4% |
| Guyanese | 1.0 /100 | #243 | Tragic 42.3% |
| Immigrants | Liberia | 0.9 /100 | #244 | Tragic 42.3% |
| Immigrants | Cambodia | 0.9 /100 | #245 | Tragic 42.3% |
| Delaware | 0.9 /100 | #246 | Tragic 42.3% |
| Immigrants | Fiji | 0.8 /100 | #247 | Tragic 42.2% |
| Immigrants | Ecuador | 0.8 /100 | #248 | Tragic 42.2% |
| Jamaicans | 0.7 /100 | #249 | Tragic 42.1% |
| U.S. Virgin Islanders | 0.7 /100 | #250 | Tragic 42.1% |
| Immigrants | Bahamas | 0.7 /100 | #251 | Tragic 42.1% |
| French American Indians | 0.6 /100 | #252 | Tragic 42.0% |
Demographics Similar to Indians (Asian) by Associate's Degree
In terms of associate's degree, the demographic groups most similar to Indians (Asian) are Immigrants from Ireland (54.7%, a difference of 0.22%), Cambodian (54.6%, a difference of 0.24%), Immigrants from Sweden (54.6%, a difference of 0.31%), Immigrants from Japan (54.6%, a difference of 0.34%), and Burmese (54.6%, a difference of 0.34%).
| Demographics | Rating | Rank | Associate's Degree |
| Immigrants | Australia | 100.0 /100 | #11 | Exceptional 55.8% |
| Immigrants | South Central Asia | 100.0 /100 | #12 | Exceptional 55.7% |
| Immigrants | China | 100.0 /100 | #13 | Exceptional 55.5% |
| Immigrants | Hong Kong | 100.0 /100 | #14 | Exceptional 55.4% |
| Immigrants | Eastern Asia | 100.0 /100 | #15 | Exceptional 55.4% |
| Soviet Union | 100.0 /100 | #16 | Exceptional 55.1% |
| Eastern Europeans | 100.0 /100 | #17 | Exceptional 55.0% |
| Indians (Asian) | 100.0 /100 | #18 | Exceptional 54.8% |
| Immigrants | Ireland | 100.0 /100 | #19 | Exceptional 54.7% |
| Cambodians | 100.0 /100 | #20 | Exceptional 54.6% |
| Immigrants | Sweden | 100.0 /100 | #21 | Exceptional 54.6% |
| Immigrants | Japan | 100.0 /100 | #22 | Exceptional 54.6% |
| Burmese | 100.0 /100 | #23 | Exceptional 54.6% |
| Immigrants | Korea | 100.0 /100 | #24 | Exceptional 54.5% |
| Immigrants | Switzerland | 100.0 /100 | #25 | Exceptional 54.5% |