Immigrants from Cambodia vs Immigrants from Albania Associate's Degree
COMPARE
Immigrants from Cambodia
Immigrants from Albania
Associate's Degree
Associate's Degree Comparison
Immigrants from Cambodia
Immigrants from Albania
42.3%
ASSOCIATE'S DEGREE
0.9/ 100
METRIC RATING
245th/ 347
METRIC RANK
48.2%
ASSOCIATE'S DEGREE
89.9/ 100
METRIC RATING
132nd/ 347
METRIC RANK
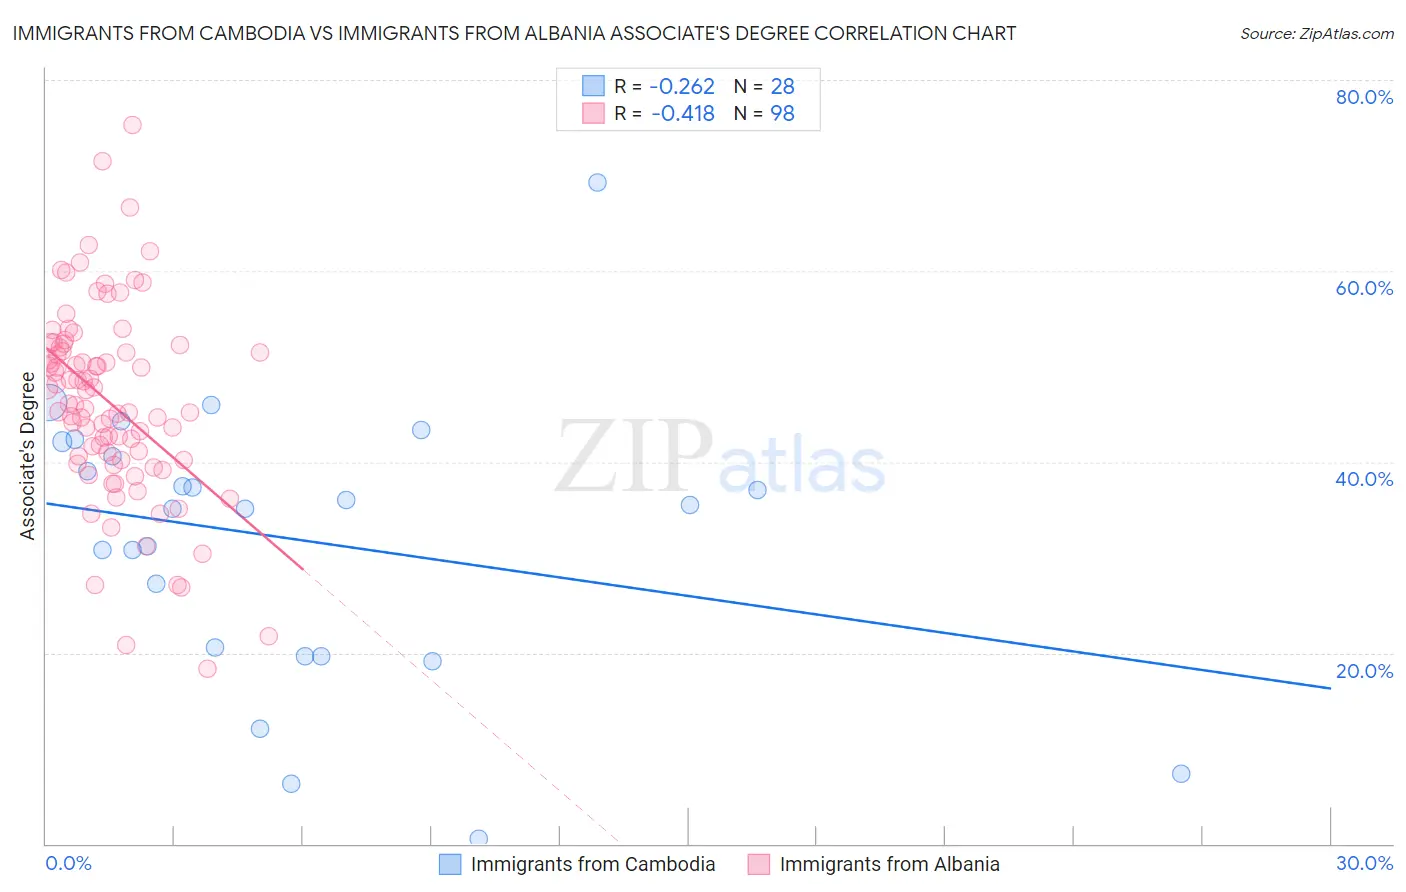
Immigrants from Cambodia vs Immigrants from Albania Associate's Degree Correlation Chart
The statistical analysis conducted on geographies consisting of 205,153,213 people shows a weak negative correlation between the proportion of Immigrants from Cambodia and percentage of population with at least associate's degree education in the United States with a correlation coefficient (R) of -0.262 and weighted average of 42.3%. Similarly, the statistical analysis conducted on geographies consisting of 119,391,185 people shows a moderate negative correlation between the proportion of Immigrants from Albania and percentage of population with at least associate's degree education in the United States with a correlation coefficient (R) of -0.418 and weighted average of 48.2%, a difference of 14.2%.
Associate's Degree Correlation Summary
| Measurement | Immigrants from Cambodia | Immigrants from Albania |
| Minimum | 0.50% | 18.3% |
| Maximum | 69.2% | 75.3% |
| Range | 68.7% | 57.0% |
| Mean | 31.9% | 46.2% |
| Median | 35.3% | 46.0% |
| Interquartile 25% (IQ1) | 20.1% | 40.3% |
| Interquartile 75% (IQ3) | 41.4% | 52.0% |
| Interquartile Range (IQR) | 21.2% | 11.7% |
| Standard Deviation (Sample) | 14.7% | 10.1% |
| Standard Deviation (Population) | 14.4% | 10.1% |
Similar Demographics by Associate's Degree
Demographics Similar to Immigrants from Cambodia by Associate's Degree
In terms of associate's degree, the demographic groups most similar to Immigrants from Cambodia are Immigrants from Liberia (42.3%, a difference of 0.020%), Delaware (42.3%, a difference of 0.030%), Immigrants from Fiji (42.2%, a difference of 0.12%), Guyanese (42.3%, a difference of 0.16%), and Immigrants from Ecuador (42.2%, a difference of 0.20%).
| Demographics | Rating | Rank | Associate's Degree |
| Iroquois | 1.7 /100 | #238 | Tragic 42.8% |
| Immigrants | Grenada | 1.3 /100 | #239 | Tragic 42.6% |
| Cree | 1.2 /100 | #240 | Tragic 42.5% |
| British West Indians | 1.0 /100 | #241 | Tragic 42.4% |
| Immigrants | West Indies | 1.0 /100 | #242 | Tragic 42.4% |
| Guyanese | 1.0 /100 | #243 | Tragic 42.3% |
| Immigrants | Liberia | 0.9 /100 | #244 | Tragic 42.3% |
| Immigrants | Cambodia | 0.9 /100 | #245 | Tragic 42.3% |
| Delaware | 0.9 /100 | #246 | Tragic 42.3% |
| Immigrants | Fiji | 0.8 /100 | #247 | Tragic 42.2% |
| Immigrants | Ecuador | 0.8 /100 | #248 | Tragic 42.2% |
| Jamaicans | 0.7 /100 | #249 | Tragic 42.1% |
| U.S. Virgin Islanders | 0.7 /100 | #250 | Tragic 42.1% |
| Immigrants | Bahamas | 0.7 /100 | #251 | Tragic 42.1% |
| French American Indians | 0.6 /100 | #252 | Tragic 42.0% |
Demographics Similar to Immigrants from Albania by Associate's Degree
In terms of associate's degree, the demographic groups most similar to Immigrants from Albania are Assyrian/Chaldean/Syriac (48.2%, a difference of 0.080%), Moroccan (48.2%, a difference of 0.10%), European (48.2%, a difference of 0.16%), Icelander (48.3%, a difference of 0.18%), and Immigrants from Jordan (48.4%, a difference of 0.29%).
| Demographics | Rating | Rank | Associate's Degree |
| Chinese | 92.5 /100 | #125 | Exceptional 48.5% |
| Immigrants | Syria | 92.2 /100 | #126 | Exceptional 48.5% |
| Immigrants | Uganda | 92.1 /100 | #127 | Exceptional 48.5% |
| Immigrants | Eastern Africa | 91.6 /100 | #128 | Exceptional 48.4% |
| Swedes | 91.5 /100 | #129 | Exceptional 48.4% |
| Immigrants | Jordan | 91.2 /100 | #130 | Exceptional 48.4% |
| Icelanders | 90.8 /100 | #131 | Exceptional 48.3% |
| Immigrants | Albania | 89.9 /100 | #132 | Excellent 48.2% |
| Assyrians/Chaldeans/Syriacs | 89.4 /100 | #133 | Excellent 48.2% |
| Moroccans | 89.3 /100 | #134 | Excellent 48.2% |
| Europeans | 89.0 /100 | #135 | Excellent 48.2% |
| Pakistanis | 88.0 /100 | #136 | Excellent 48.1% |
| Immigrants | Eritrea | 87.8 /100 | #137 | Excellent 48.1% |
| Poles | 87.3 /100 | #138 | Excellent 48.0% |
| Slovenes | 85.1 /100 | #139 | Excellent 47.9% |