Immigrants from Cambodia vs Guamanian/Chamorro In Labor Force | Age 35-44
COMPARE
Immigrants from Cambodia
Guamanian/Chamorro
In Labor Force | Age 35-44
In Labor Force | Age 35-44 Comparison
Immigrants from Cambodia
Guamanians/Chamorros
83.8%
IN LABOR FORCE | AGE 35-44
1.1/ 100
METRIC RATING
242nd/ 347
METRIC RANK
83.4%
IN LABOR FORCE | AGE 35-44
0.1/ 100
METRIC RATING
267th/ 347
METRIC RANK
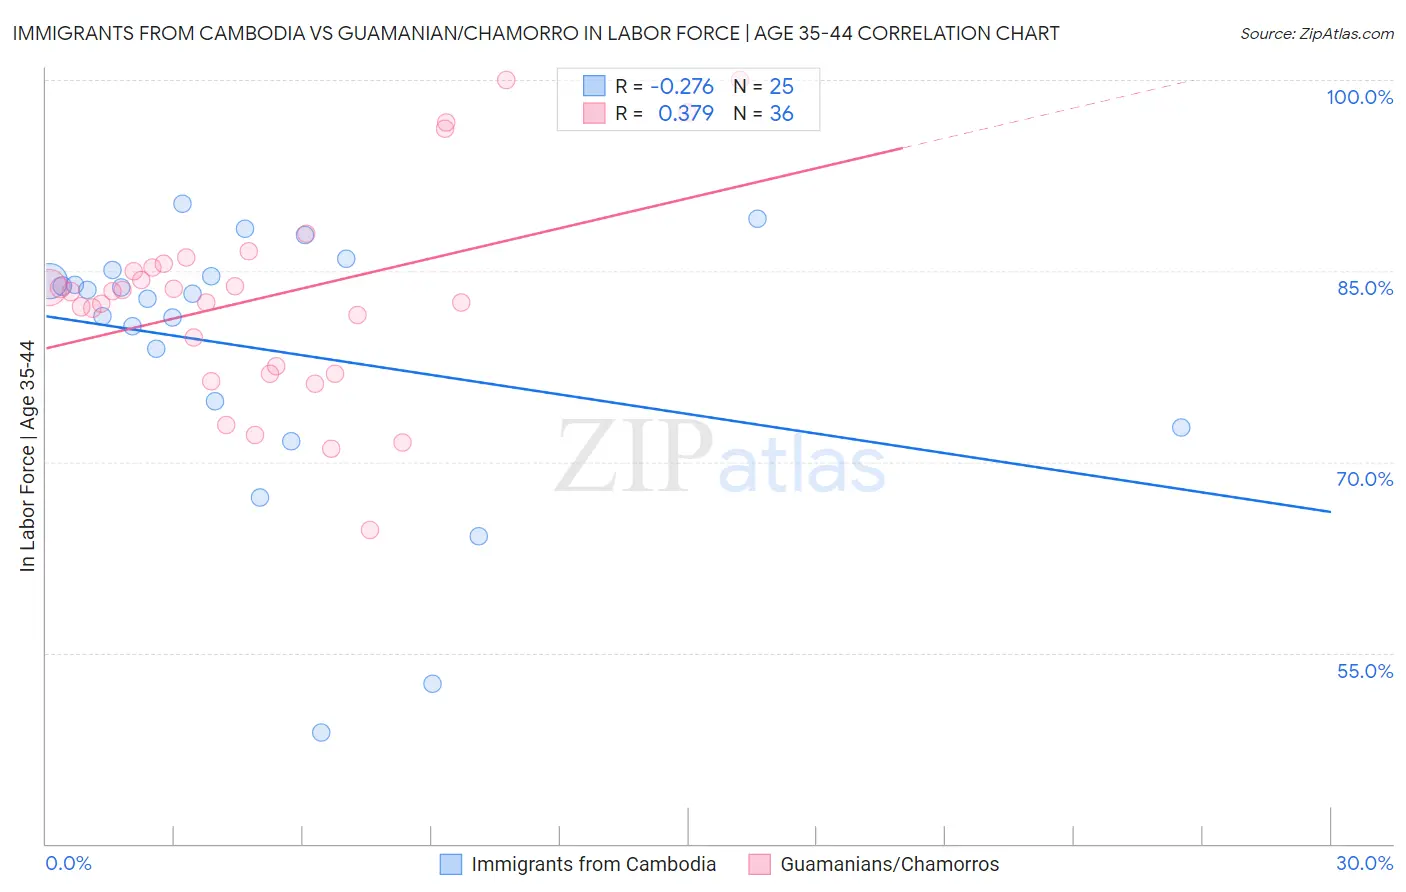
Immigrants from Cambodia vs Guamanian/Chamorro In Labor Force | Age 35-44 Correlation Chart
The statistical analysis conducted on geographies consisting of 205,131,039 people shows a weak negative correlation between the proportion of Immigrants from Cambodia and labor force participation rate among population between the ages 35 and 44 in the United States with a correlation coefficient (R) of -0.276 and weighted average of 83.8%. Similarly, the statistical analysis conducted on geographies consisting of 221,926,114 people shows a mild positive correlation between the proportion of Guamanians/Chamorros and labor force participation rate among population between the ages 35 and 44 in the United States with a correlation coefficient (R) of 0.379 and weighted average of 83.4%, a difference of 0.45%.
In Labor Force | Age 35-44 Correlation Summary
| Measurement | Immigrants from Cambodia | Guamanian/Chamorro |
| Minimum | 48.7% | 64.7% |
| Maximum | 90.3% | 100.0% |
| Range | 41.6% | 35.3% |
| Mean | 78.8% | 82.9% |
| Median | 83.2% | 83.4% |
| Interquartile 25% (IQ1) | 73.7% | 77.2% |
| Interquartile 75% (IQ3) | 84.8% | 85.4% |
| Interquartile Range (IQR) | 11.1% | 8.2% |
| Standard Deviation (Sample) | 10.7% | 8.0% |
| Standard Deviation (Population) | 10.5% | 7.9% |
Similar Demographics by In Labor Force | Age 35-44
Demographics Similar to Immigrants from Cambodia by In Labor Force | Age 35-44
In terms of in labor force | age 35-44, the demographic groups most similar to Immigrants from Cambodia are Immigrants from Western Asia (83.8%, a difference of 0.0%), Guyanese (83.8%, a difference of 0.010%), Malaysian (83.8%, a difference of 0.010%), Iraqi (83.8%, a difference of 0.020%), and Immigrants (83.7%, a difference of 0.020%).
| Demographics | Rating | Rank | In Labor Force | Age 35-44 |
| Immigrants | Syria | 2.5 /100 | #235 | Tragic 83.9% |
| West Indians | 2.4 /100 | #236 | Tragic 83.9% |
| English | 1.8 /100 | #237 | Tragic 83.8% |
| Immigrants | Laos | 1.7 /100 | #238 | Tragic 83.8% |
| Celtics | 1.4 /100 | #239 | Tragic 83.8% |
| Arabs | 1.3 /100 | #240 | Tragic 83.8% |
| Iraqis | 1.3 /100 | #241 | Tragic 83.8% |
| Immigrants | Cambodia | 1.1 /100 | #242 | Tragic 83.8% |
| Immigrants | Western Asia | 1.1 /100 | #243 | Tragic 83.8% |
| Guyanese | 1.1 /100 | #244 | Tragic 83.8% |
| Malaysians | 1.1 /100 | #245 | Tragic 83.8% |
| Immigrants | Immigrants | 1.0 /100 | #246 | Tragic 83.7% |
| Immigrants | Armenia | 0.9 /100 | #247 | Tragic 83.7% |
| Indonesians | 0.8 /100 | #248 | Tragic 83.7% |
| Immigrants | St. Vincent and the Grenadines | 0.7 /100 | #249 | Tragic 83.7% |
Demographics Similar to Guamanians/Chamorros by In Labor Force | Age 35-44
In terms of in labor force | age 35-44, the demographic groups most similar to Guamanians/Chamorros are Honduran (83.4%, a difference of 0.030%), Immigrants from Grenada (83.3%, a difference of 0.040%), Spaniard (83.4%, a difference of 0.050%), Central American (83.5%, a difference of 0.080%), and Scotch-Irish (83.5%, a difference of 0.090%).
| Demographics | Rating | Rank | In Labor Force | Age 35-44 |
| Vietnamese | 0.2 /100 | #260 | Tragic 83.5% |
| Immigrants | Dominica | 0.2 /100 | #261 | Tragic 83.5% |
| Immigrants | Congo | 0.2 /100 | #262 | Tragic 83.5% |
| Iroquois | 0.2 /100 | #263 | Tragic 83.5% |
| Scotch-Irish | 0.1 /100 | #264 | Tragic 83.5% |
| Central Americans | 0.1 /100 | #265 | Tragic 83.5% |
| Spaniards | 0.1 /100 | #266 | Tragic 83.4% |
| Guamanians/Chamorros | 0.1 /100 | #267 | Tragic 83.4% |
| Hondurans | 0.1 /100 | #268 | Tragic 83.4% |
| Immigrants | Grenada | 0.1 /100 | #269 | Tragic 83.3% |
| Immigrants | Honduras | 0.0 /100 | #270 | Tragic 83.3% |
| French American Indians | 0.0 /100 | #271 | Tragic 83.2% |
| Immigrants | Fiji | 0.0 /100 | #272 | Tragic 83.2% |
| Spanish | 0.0 /100 | #273 | Tragic 83.2% |
| Immigrants | Nonimmigrants | 0.0 /100 | #274 | Tragic 83.2% |