Immigrants from Cambodia vs Crow Associate's Degree
COMPARE
Immigrants from Cambodia
Crow
Associate's Degree
Associate's Degree Comparison
Immigrants from Cambodia
Crow
42.3%
ASSOCIATE'S DEGREE
0.9/ 100
METRIC RATING
245th/ 347
METRIC RANK
37.6%
ASSOCIATE'S DEGREE
0.0/ 100
METRIC RATING
316th/ 347
METRIC RANK
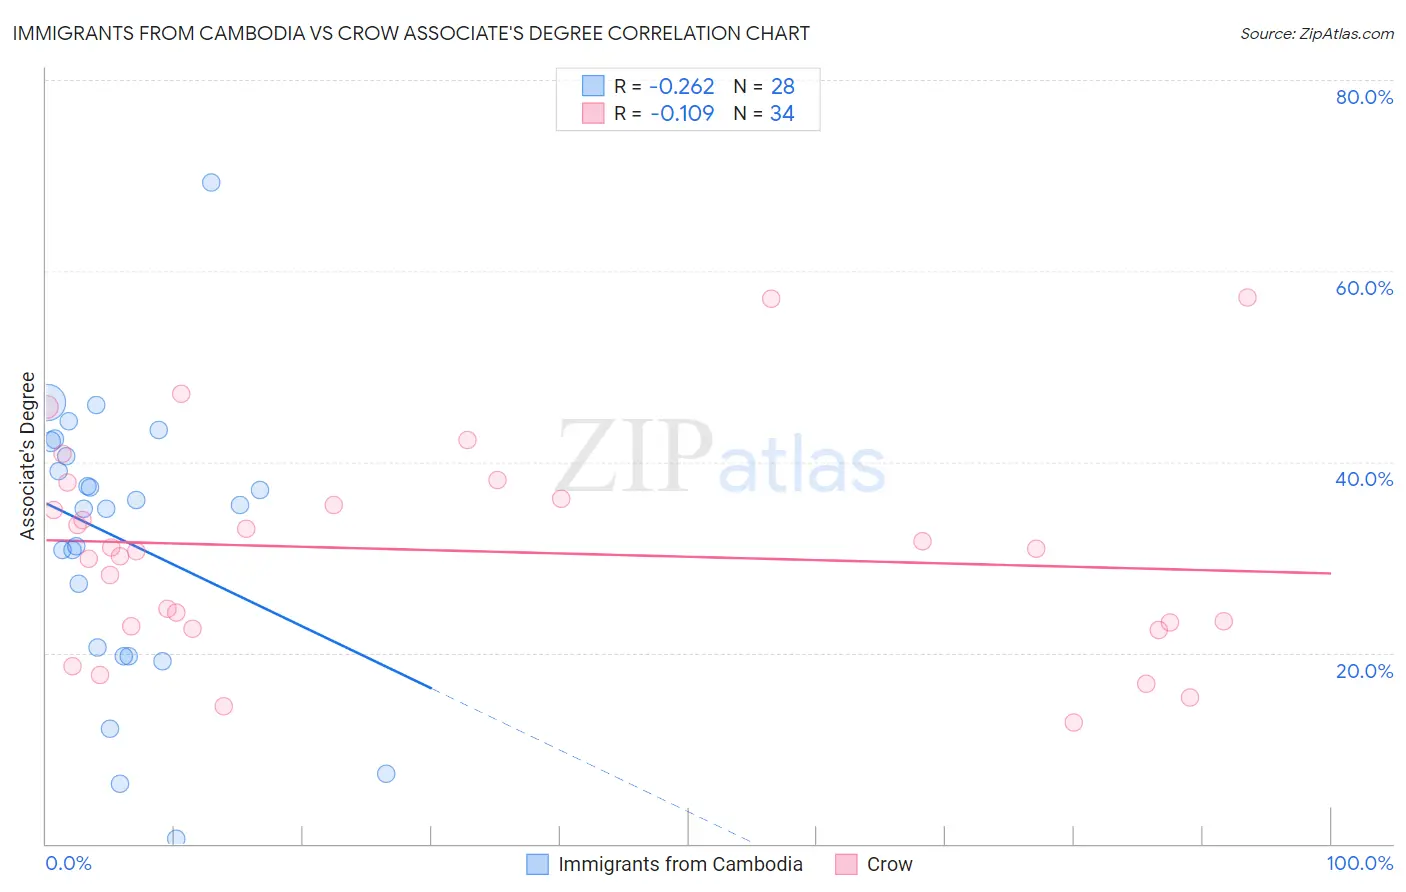
Immigrants from Cambodia vs Crow Associate's Degree Correlation Chart
The statistical analysis conducted on geographies consisting of 205,153,213 people shows a weak negative correlation between the proportion of Immigrants from Cambodia and percentage of population with at least associate's degree education in the United States with a correlation coefficient (R) of -0.262 and weighted average of 42.3%. Similarly, the statistical analysis conducted on geographies consisting of 59,209,492 people shows a poor negative correlation between the proportion of Crow and percentage of population with at least associate's degree education in the United States with a correlation coefficient (R) of -0.109 and weighted average of 37.6%, a difference of 12.5%.
Associate's Degree Correlation Summary
| Measurement | Immigrants from Cambodia | Crow |
| Minimum | 0.50% | 12.8% |
| Maximum | 69.2% | 57.2% |
| Range | 68.7% | 44.4% |
| Mean | 31.9% | 30.7% |
| Median | 35.3% | 30.8% |
| Interquartile 25% (IQ1) | 20.1% | 22.8% |
| Interquartile 75% (IQ3) | 41.4% | 36.1% |
| Interquartile Range (IQR) | 21.2% | 13.3% |
| Standard Deviation (Sample) | 14.7% | 11.1% |
| Standard Deviation (Population) | 14.4% | 10.9% |
Similar Demographics by Associate's Degree
Demographics Similar to Immigrants from Cambodia by Associate's Degree
In terms of associate's degree, the demographic groups most similar to Immigrants from Cambodia are Immigrants from Liberia (42.3%, a difference of 0.020%), Delaware (42.3%, a difference of 0.030%), Immigrants from Fiji (42.2%, a difference of 0.12%), Guyanese (42.3%, a difference of 0.16%), and Immigrants from Ecuador (42.2%, a difference of 0.20%).
| Demographics | Rating | Rank | Associate's Degree |
| Iroquois | 1.7 /100 | #238 | Tragic 42.8% |
| Immigrants | Grenada | 1.3 /100 | #239 | Tragic 42.6% |
| Cree | 1.2 /100 | #240 | Tragic 42.5% |
| British West Indians | 1.0 /100 | #241 | Tragic 42.4% |
| Immigrants | West Indies | 1.0 /100 | #242 | Tragic 42.4% |
| Guyanese | 1.0 /100 | #243 | Tragic 42.3% |
| Immigrants | Liberia | 0.9 /100 | #244 | Tragic 42.3% |
| Immigrants | Cambodia | 0.9 /100 | #245 | Tragic 42.3% |
| Delaware | 0.9 /100 | #246 | Tragic 42.3% |
| Immigrants | Fiji | 0.8 /100 | #247 | Tragic 42.2% |
| Immigrants | Ecuador | 0.8 /100 | #248 | Tragic 42.2% |
| Jamaicans | 0.7 /100 | #249 | Tragic 42.1% |
| U.S. Virgin Islanders | 0.7 /100 | #250 | Tragic 42.1% |
| Immigrants | Bahamas | 0.7 /100 | #251 | Tragic 42.1% |
| French American Indians | 0.6 /100 | #252 | Tragic 42.0% |
Demographics Similar to Crow by Associate's Degree
In terms of associate's degree, the demographic groups most similar to Crow are Creek (37.6%, a difference of 0.010%), Yaqui (37.6%, a difference of 0.020%), Alaska Native (37.5%, a difference of 0.25%), Seminole (37.7%, a difference of 0.40%), and Hispanic or Latino (37.7%, a difference of 0.45%).
| Demographics | Rating | Rank | Associate's Degree |
| Immigrants | Guatemala | 0.0 /100 | #309 | Tragic 38.1% |
| Immigrants | Dominican Republic | 0.0 /100 | #310 | Tragic 37.9% |
| Immigrants | Latin America | 0.0 /100 | #311 | Tragic 37.9% |
| Choctaw | 0.0 /100 | #312 | Tragic 37.8% |
| Hispanics or Latinos | 0.0 /100 | #313 | Tragic 37.7% |
| Seminole | 0.0 /100 | #314 | Tragic 37.7% |
| Creek | 0.0 /100 | #315 | Tragic 37.6% |
| Crow | 0.0 /100 | #316 | Tragic 37.6% |
| Yaqui | 0.0 /100 | #317 | Tragic 37.6% |
| Alaska Natives | 0.0 /100 | #318 | Tragic 37.5% |
| Fijians | 0.0 /100 | #319 | Tragic 37.4% |
| Cajuns | 0.0 /100 | #320 | Tragic 37.4% |
| Immigrants | Yemen | 0.0 /100 | #321 | Tragic 37.3% |
| Pennsylvania Germans | 0.0 /100 | #322 | Tragic 37.2% |
| Immigrants | Cabo Verde | 0.0 /100 | #323 | Tragic 36.8% |